

Supply and Demand Zones (S&D) Explained: How to Identify and Trade Them
Supply and demand zones are price ranges where institutional orders are concentrated. Learn what they are, how to identify them on any chart, and how traders use them for timing entries.

Supply and demand zones are price ranges on a chart where institutional orders are concentrated in large enough quantities to move price when reached. A demand zone forms where buy orders cluster, pushing price higher on contact. A supply zone forms where sell orders cluster, pushing price lower. Both are identified by the consolidation areas that precede sharp, impulsive moves.
What Are Supply and Demand Zones?
A supply zone is a price range where significant sell pressure is concentrated, causing price to stall or reverse lower when it enters that range. A demand zone is a price range where significant buy pressure is concentrated, causing price to stall or reverse higher.
The zones form because large institutional participants (banks, hedge funds, asset managers) cannot execute large orders at a single price without moving the market against themselves. Instead, they spread their orders across a price range and wait for price to come to them. That cluster of unfilled orders becomes the zone. When price leaves the zone sharply, some orders remain unfilled. When price returns, those orders are still there.
Supply and demand zones share the same underlying institutional logic as order blocks. The key difference is that supply and demand zones are broader ranges defined by a consolidation area, while order blocks identify a single specific candle within that range.
How to Identify Supply and Demand Zones
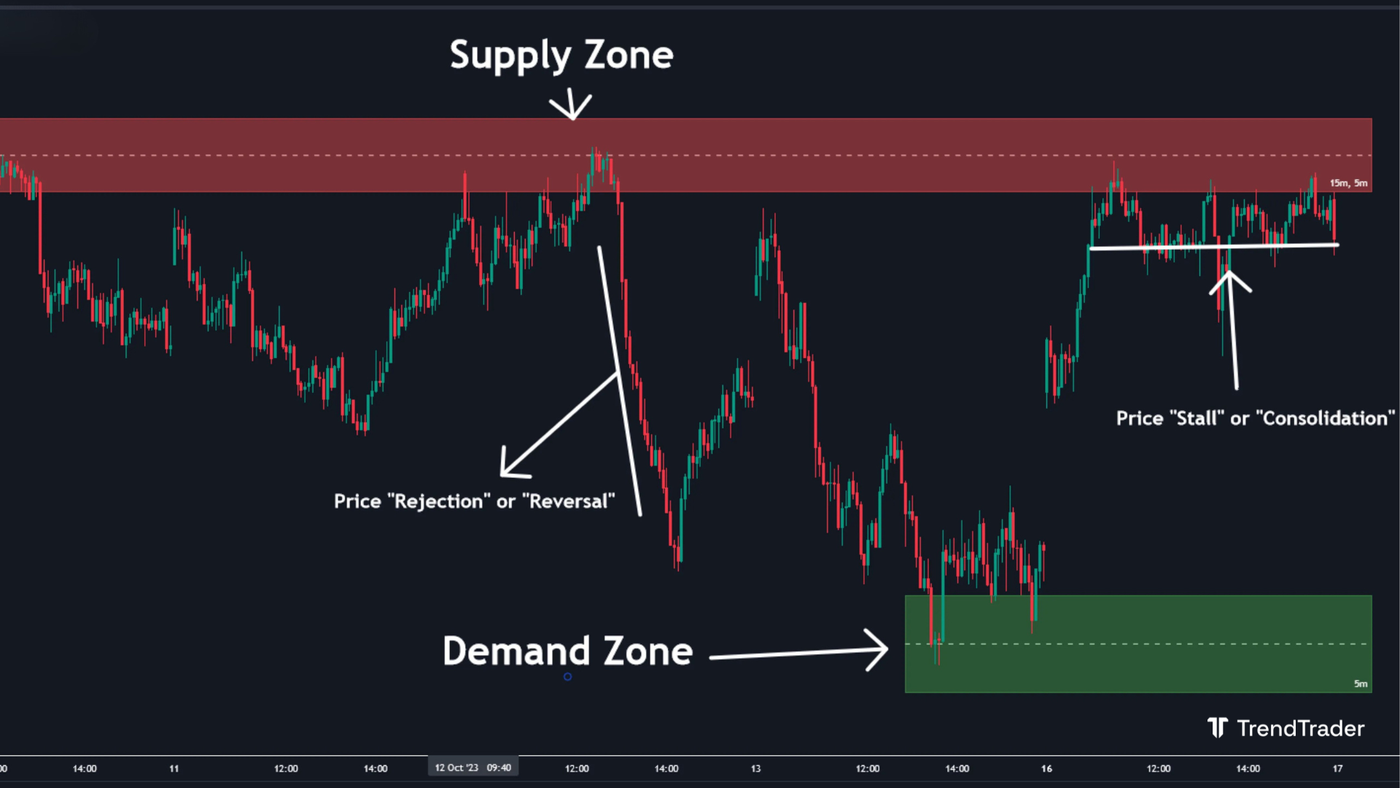
The pattern that signals a supply or demand zone is consistent: a period of consolidation followed by a sharp, impulsive move away from that area. The consolidation is where institutional orders were placed. The sharp move confirms those orders were significant enough to drive price decisively in one direction.
How to Identify a Demand Zone
A demand zone forms when price drops into or consolidates at a price range, pauses with small, indecisive candles, and then moves sharply and significantly higher. The zone is the consolidation area immediately before the impulsive move up.
The three-step pattern:
- Price drops into the zone or consolidates at that level
- Price stalls (small candles, reduced momentum)
- Price moves sharply higher with strong momentum
The lower boundary of the demand zone is typically the low of the consolidation. The upper boundary is the high of the last candle before the impulsive move began.
How to Identify a Supply Zone
A supply zone forms when price rises into or consolidates at a price range, pauses briefly, and then moves sharply and significantly lower. The zone is the consolidation immediately before the impulsive move down.
The three-step pattern:
- Price rises into the zone or consolidates at that level
- Price stalls
- Price moves sharply lower with strong momentum
The upper boundary of the supply zone is typically the high of the consolidation. The lower boundary is the low of the last candle before the impulsive move down began.
Supply and Demand Zone Examples
Here are examples of how both zone types appear on a real chart.
Supply Zone Example
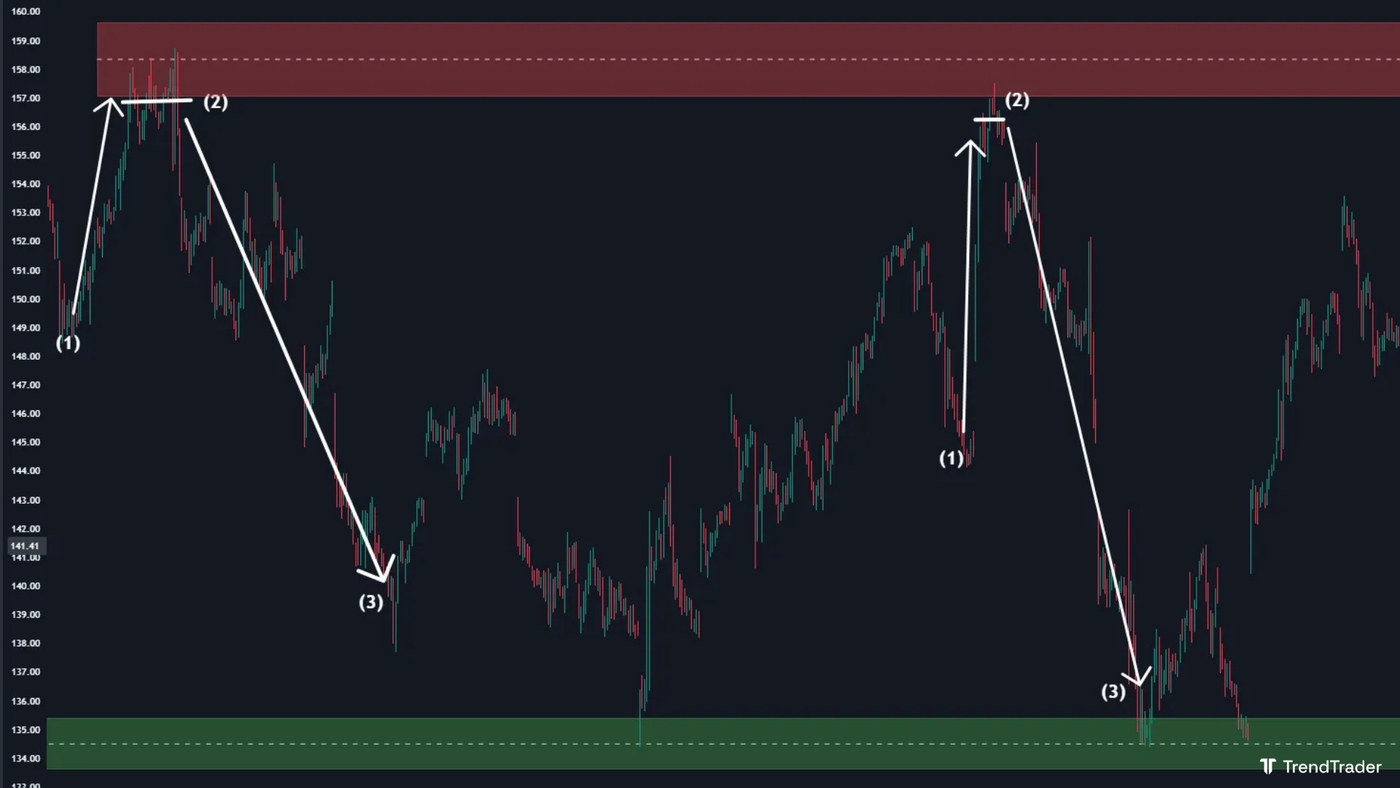
Price rises sharply into a range where a large number of sell orders are waiting from institutional participants who want to exit or establish short positions. The price stalls as buy pressure meets concentrated selling. Once the buy pressure fades, the concentrated sell orders drive price back down. The consolidation area where the stall occurred is the supply zone. On any return to that range, the same dynamic is likely to repeat until all the orders are consumed.
Demand Zone Example
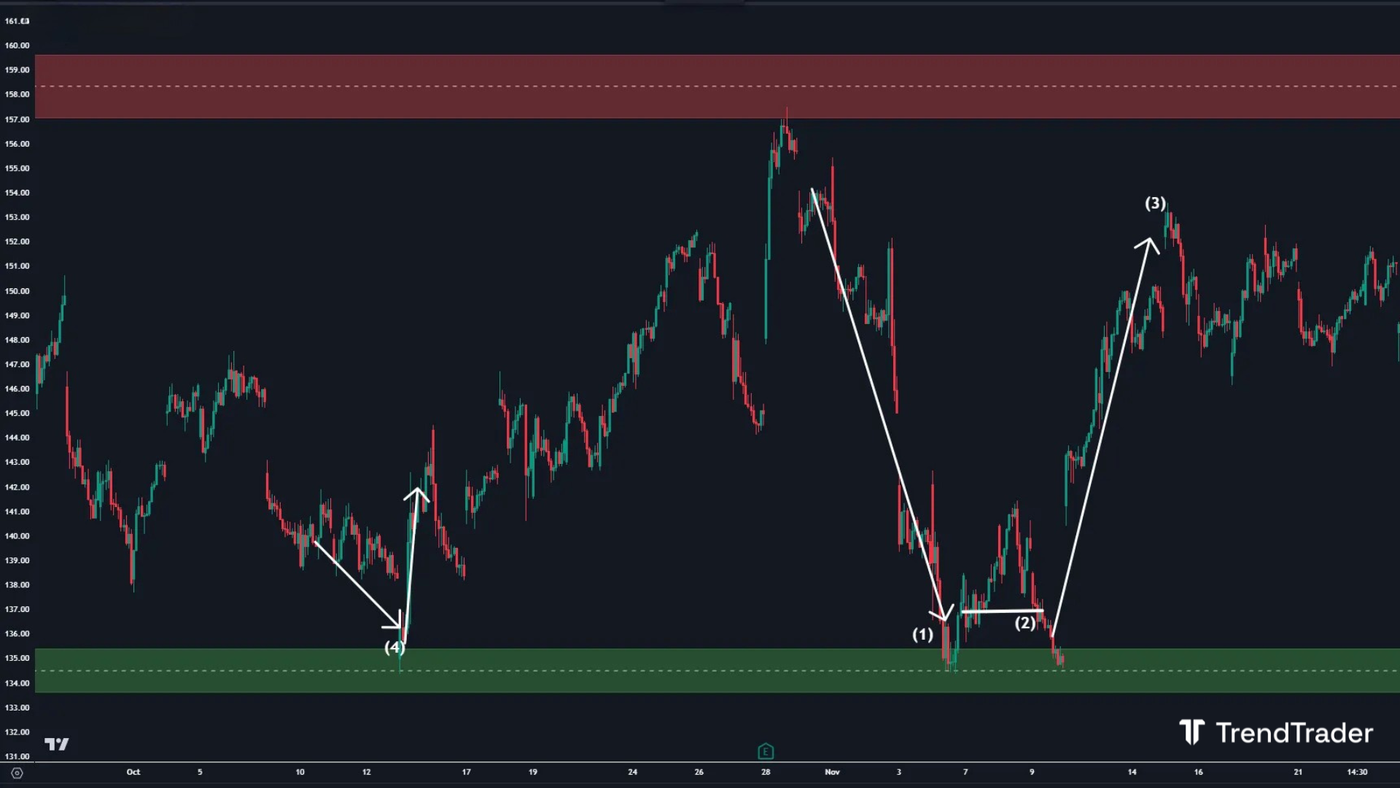
Price drops sharply into a range where a large number of buy orders are positioned by institutions acquiring the asset at a price they consider undervalued. The price stalls as sell pressure meets institutional buying. Once the sell pressure exhausts, the concentrated buy orders push price sharply higher. On a return to the zone, the same buying interest is likely to still be present.
One note: if the volume entering the zone is not large enough, price may immediately reject without any visible consolidation. Fast rejections can also mark valid zones, but they carry less certainty than zones showing clear stall-and-reverse behavior.
The Theory Behind Supply and Demand Zones
Supply and demand zones work because institutional orders are too large to execute at a single price. Large buyers and sellers distribute their orders across a range over time, creating price levels where their unfilled orders remain until price returns.
Consider a bank that determines an asset is worth $10. It wants to build a large position but cannot buy everything at once without driving the price above its target. So it places buy orders at various increments between $9.80 and $10.20, filling gradually over days or weeks. The range where this buying concentrated becomes a demand zone.
The same logic applies to selling. When large participants want to exit or short, they sell in increments at levels they consider overvalued. That accumulated sell activity forms a supply zone.
A zone holds as long as unfilled institutional orders remain there. When those orders are fully consumed, price breaks through cleanly. A clean break of a supply zone often converts it into a potential demand zone on any return visit, a concept related to what price action traders call a breaker block.
How to Trade Supply and Demand Zones
Trading supply and demand zones means entering at the zone boundary when price returns, confirming the zone is holding, and targeting the next significant level in the opposite direction.
Long Trade from a Demand Zone
When price returns to a demand zone on a pullback within an uptrend: wait for price to enter the zone and show a rejection signal (a bullish candle closing back above the zone, or a cluster of small candles followed by a strong close higher). Enter long near the upper boundary. Place the stop-loss below the lower boundary of the zone. A close below the zone means the demand has been consumed and the trade is invalid. Target the previous swing high or the nearest supply zone.
Short Trade from a Supply Zone
When price returns to a supply zone on a pullback within a downtrend: wait for price to enter the zone and show a rejection signal (a bearish candle closing below the zone's lower boundary). Enter short near the lower boundary. Place the stop-loss above the upper boundary. Target the previous swing low or the nearest demand zone.
A fresh zone (one that price has not returned to since forming) tends to hold with more force than a zone that has already been tested multiple times. Each retest consumes orders. A zone tested four or five times is closer to breaking than a zone being visited for the first time.
Best Timeframes for Supply and Demand Trading
Supply and demand zones form on every timeframe, but higher timeframe zones carry more institutional order flow and hold with greater reliability.
Daily and four-hour charts produce the most reliable zones for most traders. These timeframes reflect genuine institutional accumulation and distribution across days or weeks. A demand zone on the daily chart represents sustained buying at that level. A zone on the five-minute chart may reflect only minutes of activity by much smaller participants.
A practical approach: identify the zone on the daily or four-hour chart for directional bias, then drop to the one-hour or 15-minute chart to time the entry within the zone. This improves risk-to-reward by tightening the stop without sacrificing the directional conviction of the higher timeframe signal.
Which Markets Work Best for Supply and Demand Zones?
Supply and demand zones work best in markets with consistent institutional participation, where large players regularly accumulate and distribute positions at specific price levels.
Equities in major indices work well because institutional fund managers regularly transact at specific valuations. Forex majors (EURUSD, GBPUSD, USDJPY) work well because central banks and large currency desks create significant order flow at key levels. Gold (XAUUSD) and crude oil also produce reliable zones, driven by macro positioning from large commodity funds.
Crypto is more challenging. Bitcoin (BTCUSD) and Ethereum produce reasonably reliable zones given their size and increasing institutional involvement. Smaller-cap cryptocurrencies are harder because retail sentiment dominates, making institutional order flow less consistent.
The premium and discount framework is a useful complement to supply and demand analysis: a supply zone forming in the premium half of a range or a demand zone forming in the discount half carries higher probability than a zone forming in the opposing half.
Frequently Asked Questions
What is the difference between a supply zone and a demand zone?
A demand zone is a price range where buy orders are concentrated, causing price to move higher when it enters the zone. A supply zone is a price range where sell orders are concentrated, causing price to move lower. Both are identified by the consolidation that occurs before a sharp impulsive move, which marks where the institutional orders were placed.
How do you draw supply and demand zones on a chart?
Find a sharp, impulsive price move. Locate the consolidation area immediately before that move. Draw a rectangle covering the high and low of that consolidation and extend it to the right. The lower boundary is the zone floor, the upper boundary is the zone ceiling. Entries are taken near the appropriate boundary when price returns to the zone.
How many times can a supply or demand zone be retested before failing?
There is no fixed number. A zone holds as long as unfilled institutional orders remain there. Each retest consumes some of those orders. Fresh zones (first retest) tend to hold most strongly. Zones tested four or five times have consumed most of their original order volume and are more likely to fail on the next visit. A clean break of a zone signals the orders have been fully absorbed.
Are supply and demand zones the same as support and resistance?
They share the same underlying logic but use different identification methods. Support and resistance is typically drawn at price levels that have been tested repeatedly. Supply and demand zones are drawn specifically at consolidation areas before sharp impulsive moves, making them a more precise identification of where institutional orders clustered. A strong support level is often also a demand zone, but not all support levels qualify as supply or demand zones.
Do supply and demand zones work in forex?
Yes. Forex majors produce reliable supply and demand zones because central banks, large commercial banks, and institutional forex desks execute large orders at specific price levels. EURUSD, GBPUSD, and USDJPY in particular form clean zones around key macro levels. Daily and four-hour charts show the most reliable zones in forex, aligned with how institutional participants manage longer-term positions.
This article is for educational purposes only and does not constitute financial advice. Trading involves significant risk of loss. Do your own research and consult a licensed financial advisor before making any trading decisions.
Find more guides on price action concepts and trading strategies on the TrendTrader blog.
