
2020–2026 Performance Report
Historical backtest of daily and intraday trade performance. 1 January 2020 – 11 September 2026. Results, risk, costs, and methodology in 16 pages.
This page could not load. Try again or select Text view above.
Read page 1 as text
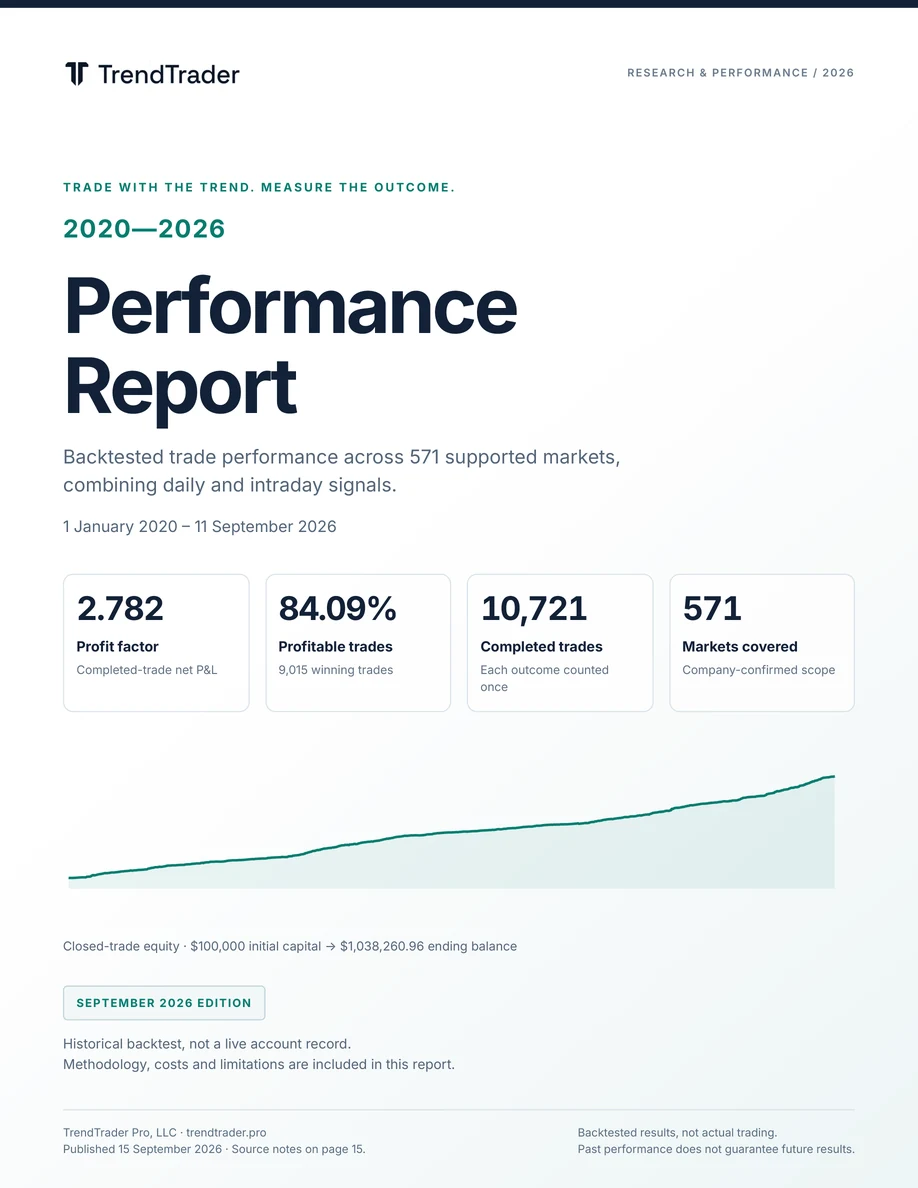
2020–2026 Performance Report
Trade with the trend. Measure the outcome.
Backtested trade performance across 571 supported markets, combining daily and intraday signals.
1 January 2020 – 11 September 2026
| Measure | Result | Basis |
|---|---|---|
| Profit factor | 2.782 | Completed-trade net P&L |
| Profitable trades | 84.09% | 9,015 winning trades |
| Completed trades | 10,721 | Each outcome counted once |
| Markets covered | 571 | Company-confirmed scope |
Closed-trade equity · $100,000 initial capital → $1,038,260.96 ending balance
SEPTEMBER 2026 EDITION
Historical backtest, not a live account record. Methodology, costs and limitations are included in this report.
TrendTrader Pro, LLC · trendtrader.pro Published 15 September 2026 · Source notes on page 15.
Backtested results, not actual trading. Past performance does not guarantee future results.
This page could not load. Try again or select Text view above.
Read page 2 as text
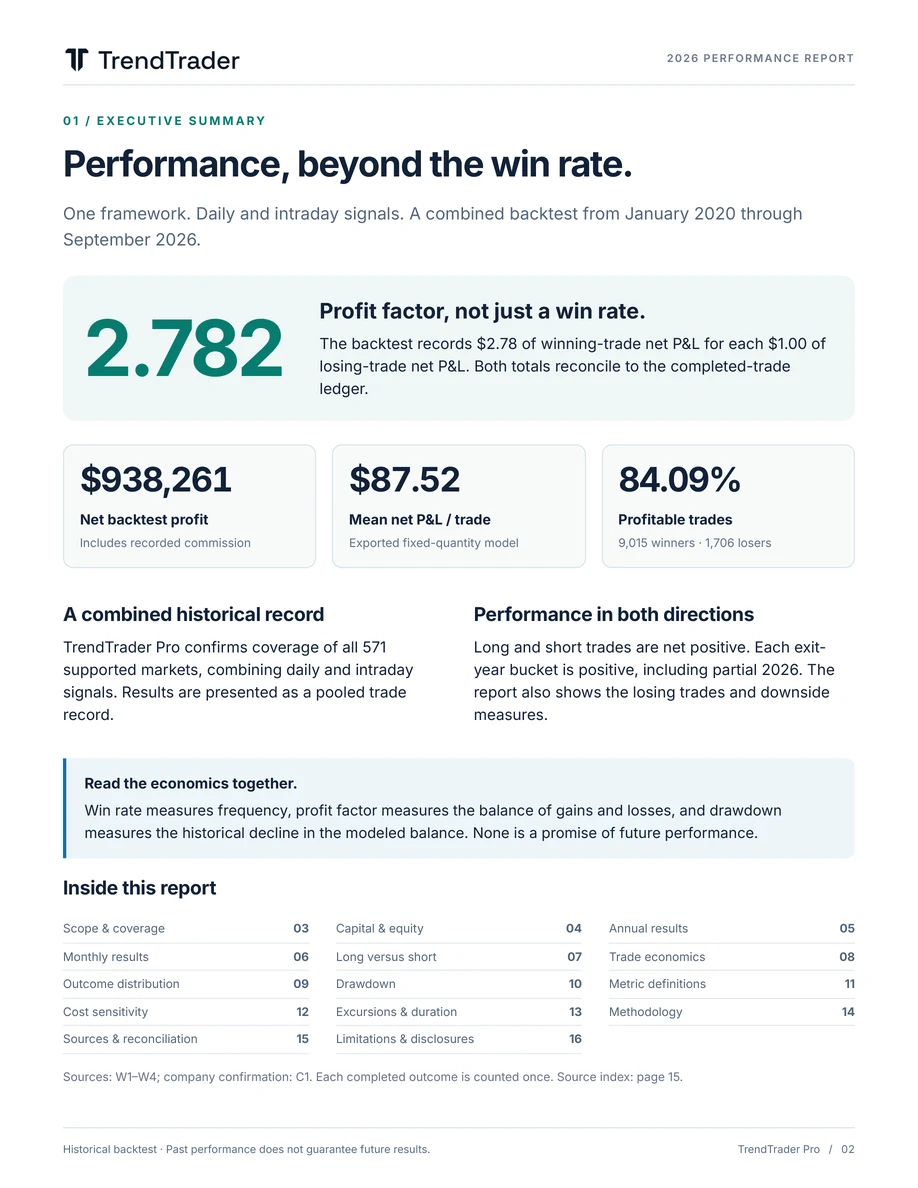
Performance, beyond the win rate.
One framework. Daily and intraday signals. A combined backtest from January 2020 through
September 2026.
Profit factor, not just a win rate.
2.782
The backtest records $2.78 of winning-trade net P&L for each $1.00 of losing-trade net P&L. Both totals reconcile to the completed-trade ledger.
| Measure | Result | Basis |
|---|---|---|
| Net backtest profit | $938,261 | Includes recorded commission |
| Mean net P&L / trade | $87.52 | Exported fixed-quantity model |
| Profitable trades | 84.09% | 9,015 winners · 1,706 losers |
A combined historical record
TrendTrader Pro confirms coverage of all 571 supported markets, combining daily and intraday signals. Results are presented as a pooled trade record.
Performance in both directions
Long and short trades are net positive. Each exit- year bucket is positive, including partial 2026. The report also shows the losing trades and downside measures.
Read the economics together.
Win rate measures frequency, profit factor measures the balance of gains and losses, and drawdown
measures the historical decline in the modeled balance. None is a promise of future performance.
Inside this report
Scope & coverage 03 Capital & equity 04 Annual results 05
Monthly results 06 Long versus short 07 Trade economics 08
Outcome distribution 09 Drawdown 10 Metric definitions 11
Cost sensitivity 12 Excursions & duration 13 Methodology 14
Sources & reconciliation 15 Limitations & disclosures 16
Sources: W1–W4; company confirmation: C1. Each completed outcome is counted once. Source index: page 15.
Historical backtest · Past performance does not guarantee future results. TrendTrader Pro / 02
This page could not load. Try again or select Text view above.
Read page 3 as text
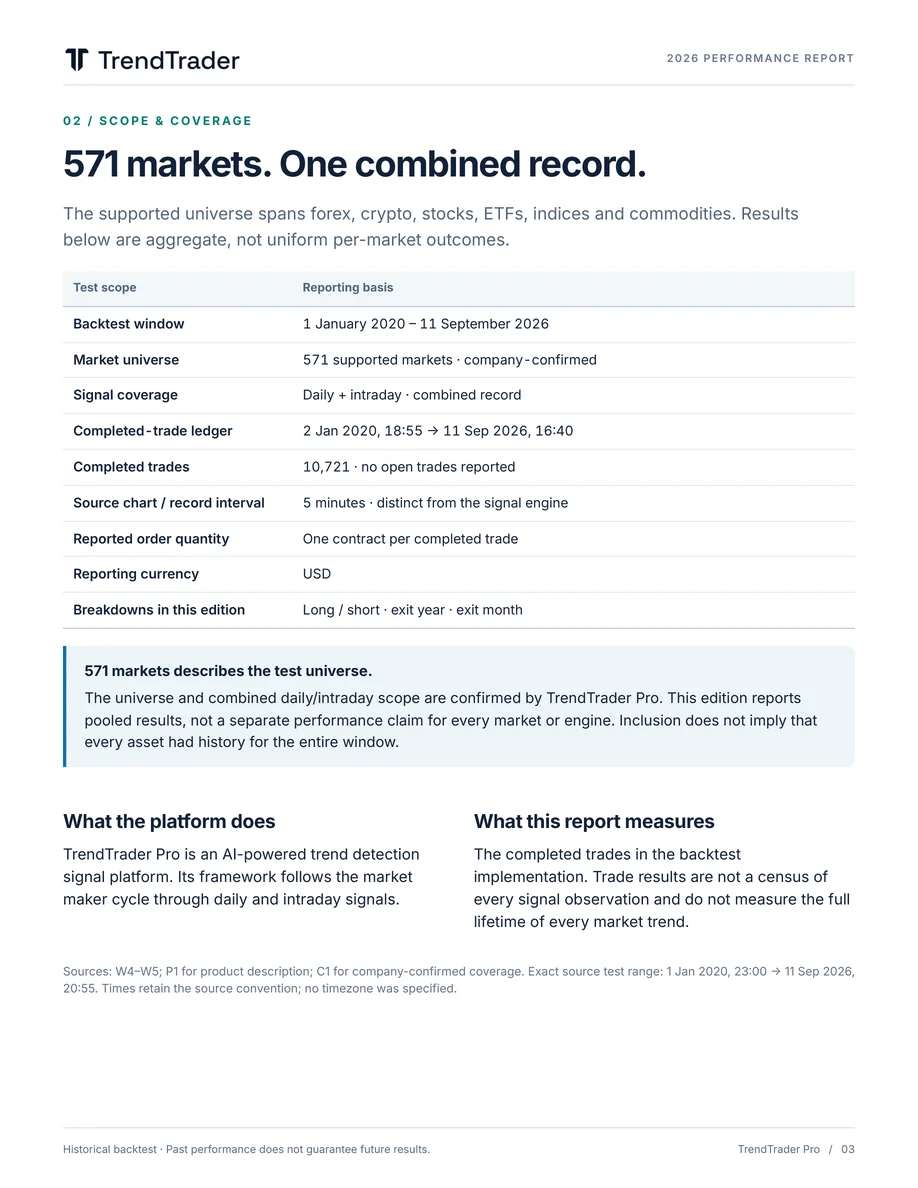
571 markets. One combined record.
The supported universe spans forex, crypto, stocks, ETFs, indices and commodities. Results
below are aggregate, not uniform per-market outcomes.
| Test scope | Reporting basis |
|---|---|
| Backtest window | 1 January 2020 – 11 September 2026 |
| Market universe | 571 supported markets · company-confirmed |
| Signal coverage | Daily + intraday · combined record |
| Completed-trade ledger | 2 Jan 2020, 18:55 → 11 Sep 2026, 16:40 |
| Completed trades | 10,721 · no open trades reported |
| Source chart / record interval | 5 minutes · distinct from the signal engine |
| Reported order quantity | One contract per completed trade |
| Reporting currency | USD |
| Breakdowns in this edition | Long / short · exit year · exit month |
571 markets describes the test universe.
The universe and combined daily/intraday scope are confirmed by TrendTrader Pro. This edition reports
pooled results, not a separate performance claim for every market or engine. Inclusion does not imply that every asset had history for the entire window.
What the platform does
TrendTrader Pro is an AI-powered trend detection signal platform. Its framework follows the market maker cycle through daily and intraday signals.
What this report measures
The completed trades in the backtest implementation. Trade results are not a census of every signal observation and do not measure the full lifetime of every market trend.
Sources: W4–W5; P1 for product description; C1 for company-confirmed coverage. Exact source test range: 1 Jan 2020, 23:00 → 11 Sep 2026, 20:55. Times retain the source convention; no timezone was specified.
Historical backtest · Past performance does not guarantee future results. TrendTrader Pro / 03
This page could not load. Try again or select Text view above.
Read page 4 as text
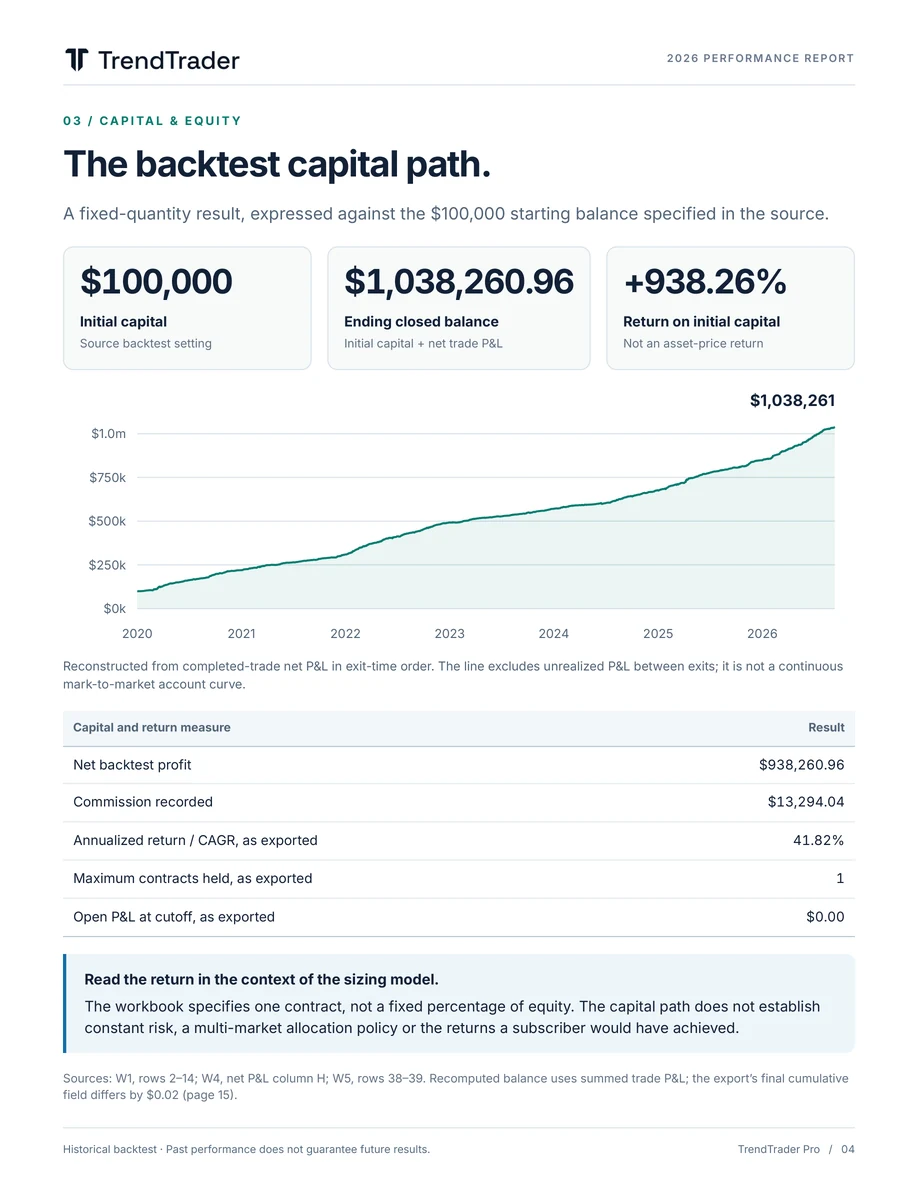
The backtest capital path.
A fixed-quantity result, expressed against the $100,000 starting balance specified in the source.
| Measure | Result | Basis |
|---|---|---|
| Initial capital | $100,000 | Source backtest setting |
| Ending closed balance | $1,038,260.96 | Initial capital + net trade P&L |
| Return on initial capital | +938.26% | Not an asset-price return |
Reconstructed from completed-trade net P&L in exit-time order. The line excludes unrealized P&L between exits; it is not a continuous mark-to-market account curve.
| Capital and return measure | Result |
|---|---|
| Net backtest profit | $938,260.96 |
| Commission recorded | $13,294.04 |
| Annualized return / CAGR, as exported | 41.82% |
| Maximum contracts held, as exported | 1 |
| Open P&L at cutoff, as exported | $0.00 |
Read the return in the context of the sizing model.
The workbook specifies one contract, not a fixed percentage of equity. The capital path does not establish constant risk, a multi-market allocation policy or the returns a subscriber would have achieved.
Sources: W1, rows 2–14; W4, net P&L column H; W5, rows 38–39. Recomputed balance uses summed trade P&L; the export’s final cumulative field differs by $0.02 (page 15).
Historical backtest · Past performance does not guarantee future results. TrendTrader Pro / 04
This page could not load. Try again or select Text view above.
Read page 5 as text
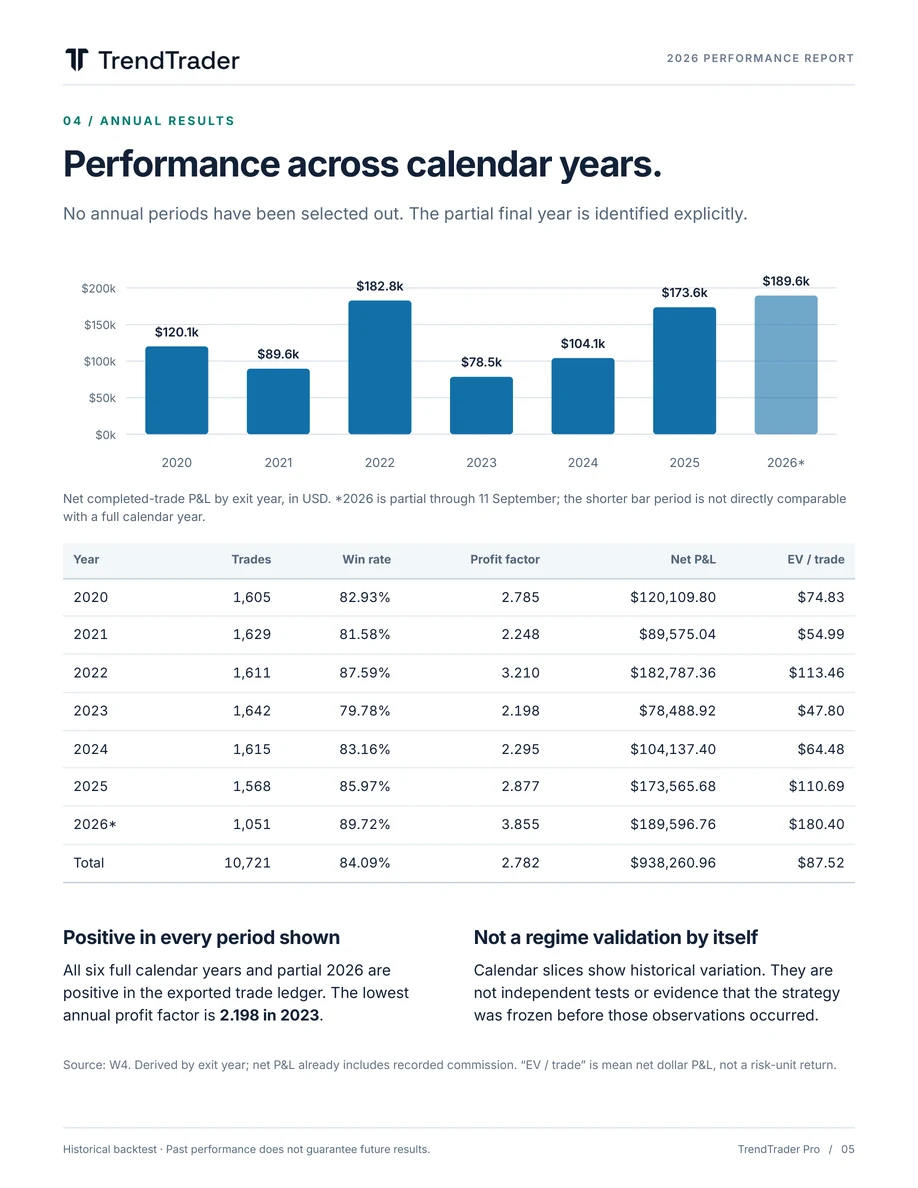
Performance across calendar years.
No annual periods have been selected out. The partial final year is identified explicitly.
Net completed-trade P&L by exit year, in USD. *2026 is partial through 11 September; the shorter bar period is not directly comparable with a full calendar year.
| Year | Trades | Win rate | Profit factor | Net P&L | EV / trade |
|---|---|---|---|---|---|
| 2020 | 1,605 | 82.93% | 2.785 | $120,109.80 | $74.83 |
| 2021 | 1,629 | 81.58% | 2.248 | $89,575.04 | $54.99 |
| 2022 | 1,611 | 87.59% | 3.210 | $182,787.36 | $113.46 |
| 2023 | 1,642 | 79.78% | 2.198 | $78,488.92 | $47.80 |
| 2024 | 1,615 | 83.16% | 2.295 | $104,137.40 | $64.48 |
| 2025 | 1,568 | 85.97% | 2.877 | $173,565.68 | $110.69 |
| 2026* | 1,051 | 89.72% | 3.855 | $189,596.76 | $180.40 |
| Total | 10,721 | 84.09% | 2.782 | $938,260.96 | $87.52 |
Positive in every period shown
All six full calendar years and partial 2026 are positive in the exported trade ledger. The lowest annual profit factor is 2.198 in 2023.
Not a regime validation by itself
Calendar slices show historical variation. They are not independent tests or evidence that the strategy was frozen before those observations occurred.
Source: W4. Derived by exit year; net P&L already includes recorded commission. “EV / trade” is mean net dollar P&L, not a risk-unit return.
Historical backtest · Past performance does not guarantee future results. TrendTrader Pro / 05
This page could not load. Try again or select Text view above.
Read page 6 as text
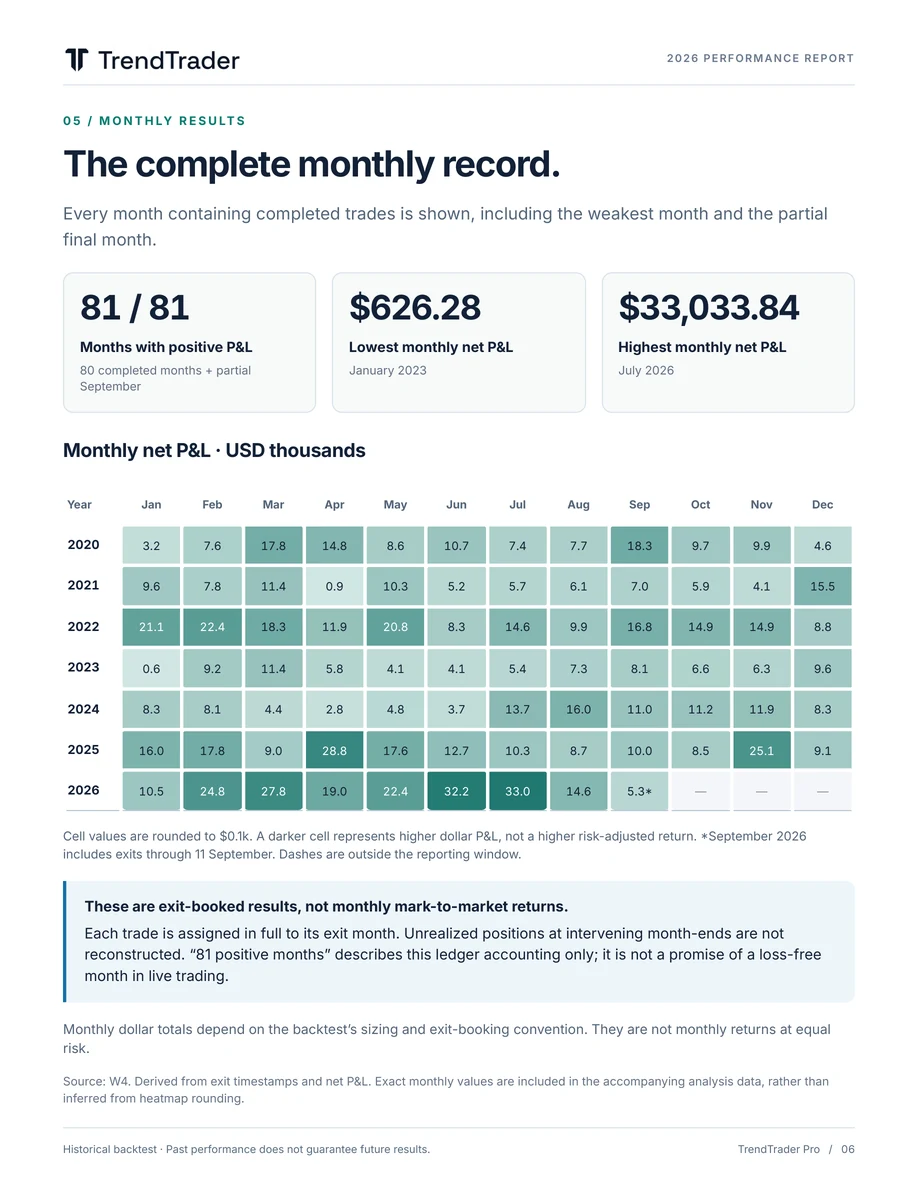
The complete monthly record.
Every month containing completed trades is shown, including the weakest month and the partial
final month.
| Measure | Result | Basis |
|---|---|---|
| Months with positive P&L | 81 / 81 | 80 completed months + partial September |
| Lowest monthly net P&L | $626.28 | January 2023 |
| Highest monthly net P&L | $33,033.84 | July 2026 |
Monthly net P&L · USD thousands
| Year | Jan | Feb | Mar | Apr | May | Jun | Jul | Aug | Sep | Oct | Nov | Dec |
|---|---|---|---|---|---|---|---|---|---|---|---|---|
| 2020 | 3.2 | 7.6 | 17.8 | 14.8 | 8.6 | 10.7 | 7.4 | 7.7 | 18.3 | 9.7 | 9.9 | 4.6 |
| 2021 | 9.6 | 7.8 | 11.4 | 0.9 | 10.3 | 5.2 | 5.7 | 6.1 | 7.0 | 5.9 | 4.1 | 15.5 |
| 2022 | 21.1 | 22.4 | 18.3 | 11.9 | 20.8 | 8.3 | 14.6 | 9.9 | 16.8 | 14.9 | 14.9 | 8.8 |
| 2023 | 0.6 | 9.2 | 11.4 | 5.8 | 4.1 | 4.1 | 5.4 | 7.3 | 8.1 | 6.6 | 6.3 | 9.6 |
| 2024 | 8.3 | 8.1 | 4.4 | 2.8 | 4.8 | 3.7 | 13.7 | 16.0 | 11.0 | 11.2 | 11.9 | 8.3 |
| 2025 | 16.0 | 17.8 | 9.0 | 28.8 | 17.6 | 12.7 | 10.3 | 8.7 | 10.0 | 8.5 | 25.1 | 9.1 |
| 2026 | 10.5 | 24.8 | 27.8 | 19.0 | 22.4 | 32.2 | 33.0 | 14.6 | 5.3* | — | — | — |
Cell values are rounded to $0.1k. A darker cell represents higher dollar P&L, not a higher risk-adjusted return. *September 2026 includes exits through 11 September. Dashes are outside the reporting window.
These are exit-booked results, not monthly mark-to-market returns.
Each trade is assigned in full to its exit month. Unrealized positions at intervening month-ends are not reconstructed. “81 positive months” describes this ledger accounting only; it is not a promise of a loss-free month in live trading.
Monthly dollar totals depend on the backtest’s sizing and exit-booking convention. They are not monthly returns at equal risk.
Source: W4. Derived from exit timestamps and net P&L. Exact monthly values are included in the accompanying analysis data, rather than inferred from heatmap rounding.
Historical backtest · Past performance does not guarantee future results. TrendTrader Pro / 06
This page could not load. Try again or select Text view above.
Read page 7 as text
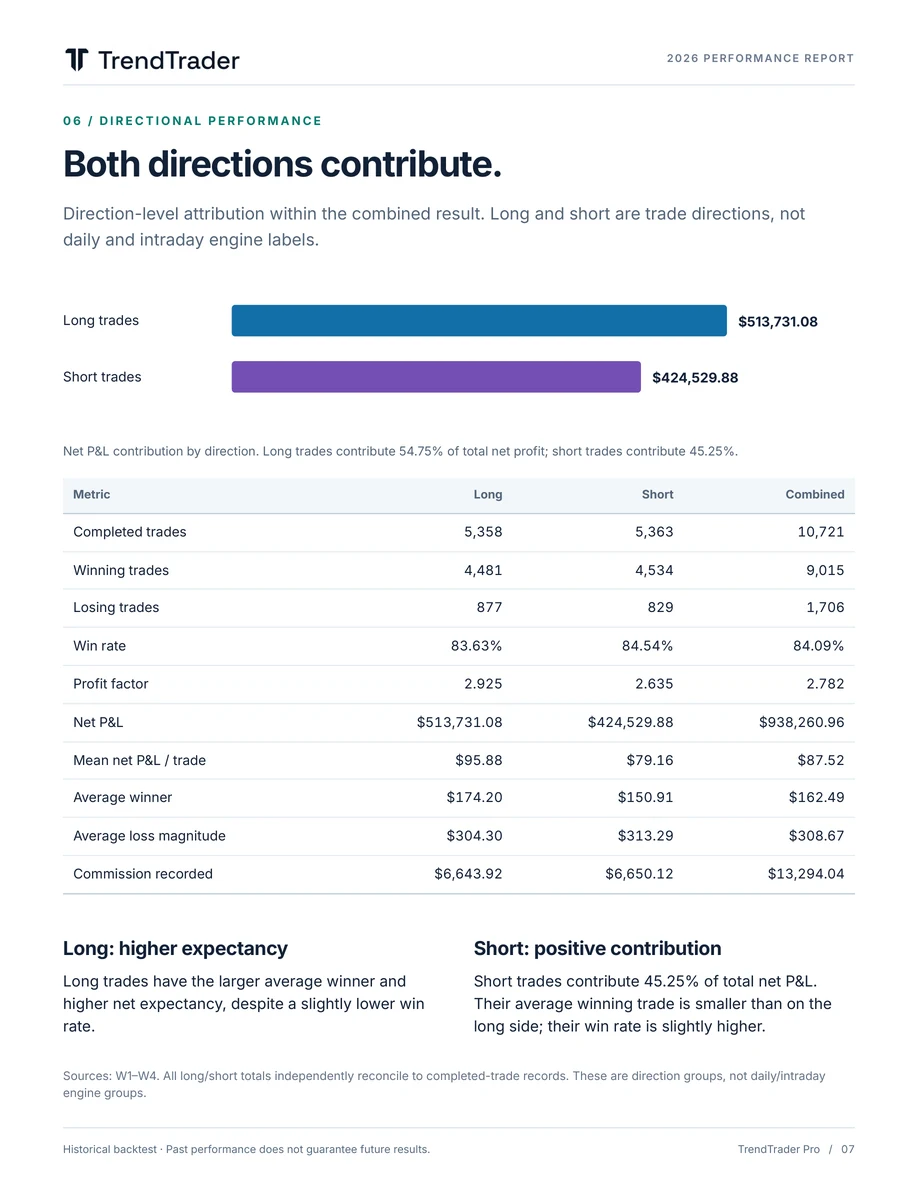
Both directions contribute.
Direction-level attribution within the combined result. Long and short are trade directions, not
daily and intraday engine labels.
Long trades $513,731.08
Short trades $424,529.88
Net P&L contribution by direction. Long trades contribute 54.75% of total net profit; short trades contribute 45.25%.
| Metric | Long | Short | Combined |
|---|---|---|---|
| Completed trades | 5,358 | 5,363 | 10,721 |
| Winning trades | 4,481 | 4,534 | 9,015 |
| Losing trades | 877 | 829 | 1,706 |
| Win rate | 83.63% | 84.54% | 84.09% |
| Profit factor | 2.925 | 2.635 | 2.782 |
| Net P&L | $513,731.08 | $424,529.88 | $938,260.96 |
| Mean net P&L / trade | $95.88 | $79.16 | $87.52 |
| Average winner | $174.20 | $150.91 | $162.49 |
| Average loss magnitude | $304.30 | $313.29 | $308.67 |
| Commission recorded | $6,643.92 | $6,650.12 | $13,294.04 |
Long: higher expectancy
Long trades have the larger average winner and higher net expectancy, despite a slightly lower win rate.
Short: positive contribution
Short trades contribute 45.25% of total net P&L. Their average winning trade is smaller than on the long side; their win rate is slightly higher.
Sources: W1–W4. All long/short totals independently reconcile to completed-trade records. These are direction groups, not daily/intraday engine groups.
Historical backtest · Past performance does not guarantee future results. TrendTrader Pro / 07
This page could not load. Try again or select Text view above.
Read page 8 as text
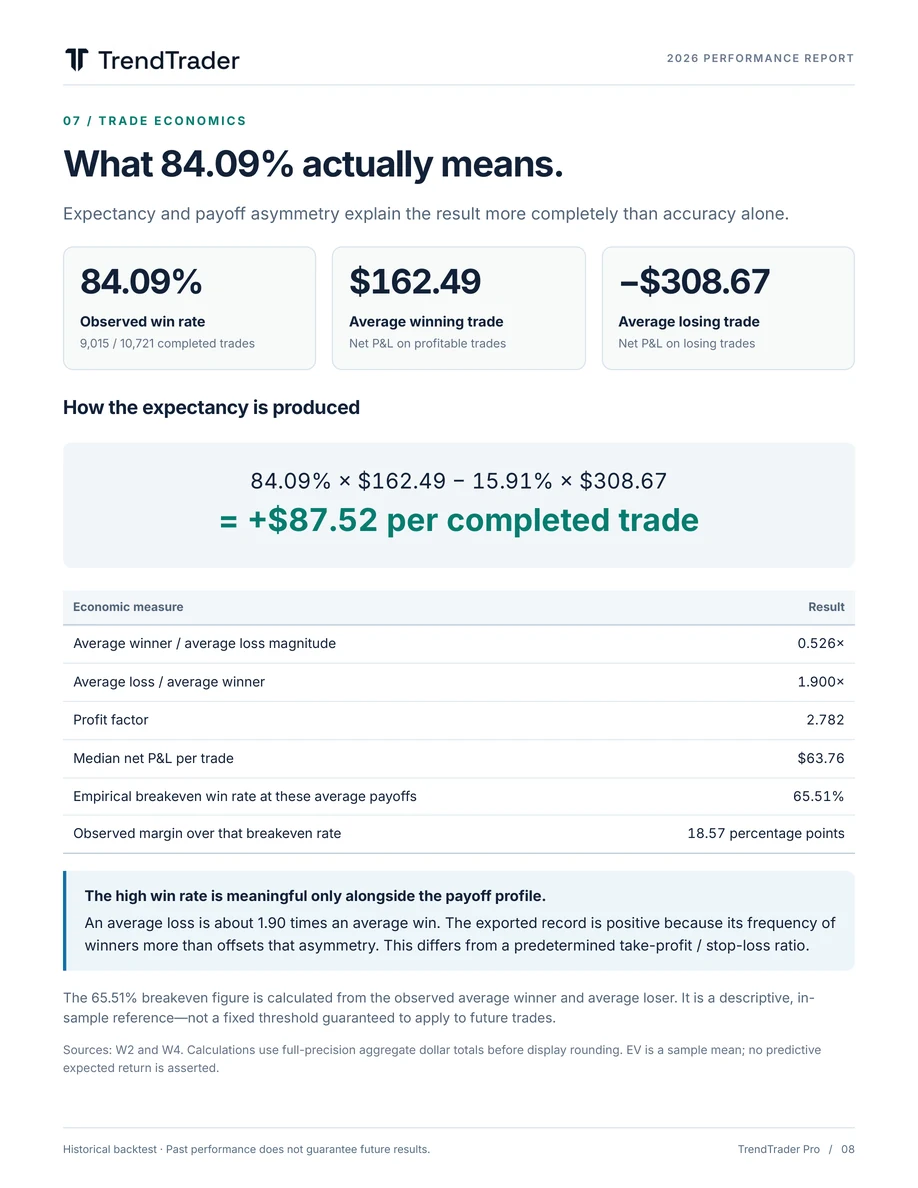
What 84.09% actually means.
Expectancy and payoff asymmetry explain the result more completely than accuracy alone.
| Measure | Result | Basis |
|---|---|---|
| Observed win rate | 84.09% | 9,015 / 10,721 completed trades |
| Average winning trade | $162.49 | Net P&L on profitable trades |
| Average losing trade | −$308.67 | Net P&L on losing trades |
How the expectancy is produced
84.09% × $162.49 − 15.91% × $308.67 = +$87.52 per completed trade
| Economic measure | Result |
|---|---|
| Average winner / average loss magnitude | 0.526× |
| Average loss / average winner | 1.900× |
| Profit factor | 2.782 |
| Median net P&L per trade | $63.76 |
| Empirical breakeven win rate at these average payoffs | 65.51% |
| Observed margin over that breakeven rate | 18.57 percentage points |
The high win rate is meaningful only alongside the payoff profile.
An average loss is about 1.90 times an average win. The exported record is positive because its frequency of
winners more than offsets that asymmetry. This differs from a predetermined take-profit / stop-loss ratio.
The 65.51% breakeven figure is calculated from the observed average winner and average loser. It is a descriptive, in- sample reference—not a fixed threshold guaranteed to apply to future trades.
Sources: W2 and W4. Calculations use full-precision aggregate dollar totals before display rounding. EV is a sample mean; no predictive
expected return is asserted.
Historical backtest · Past performance does not guarantee future results. TrendTrader Pro / 08
This page could not load. Try again or select Text view above.
Read page 9 as text
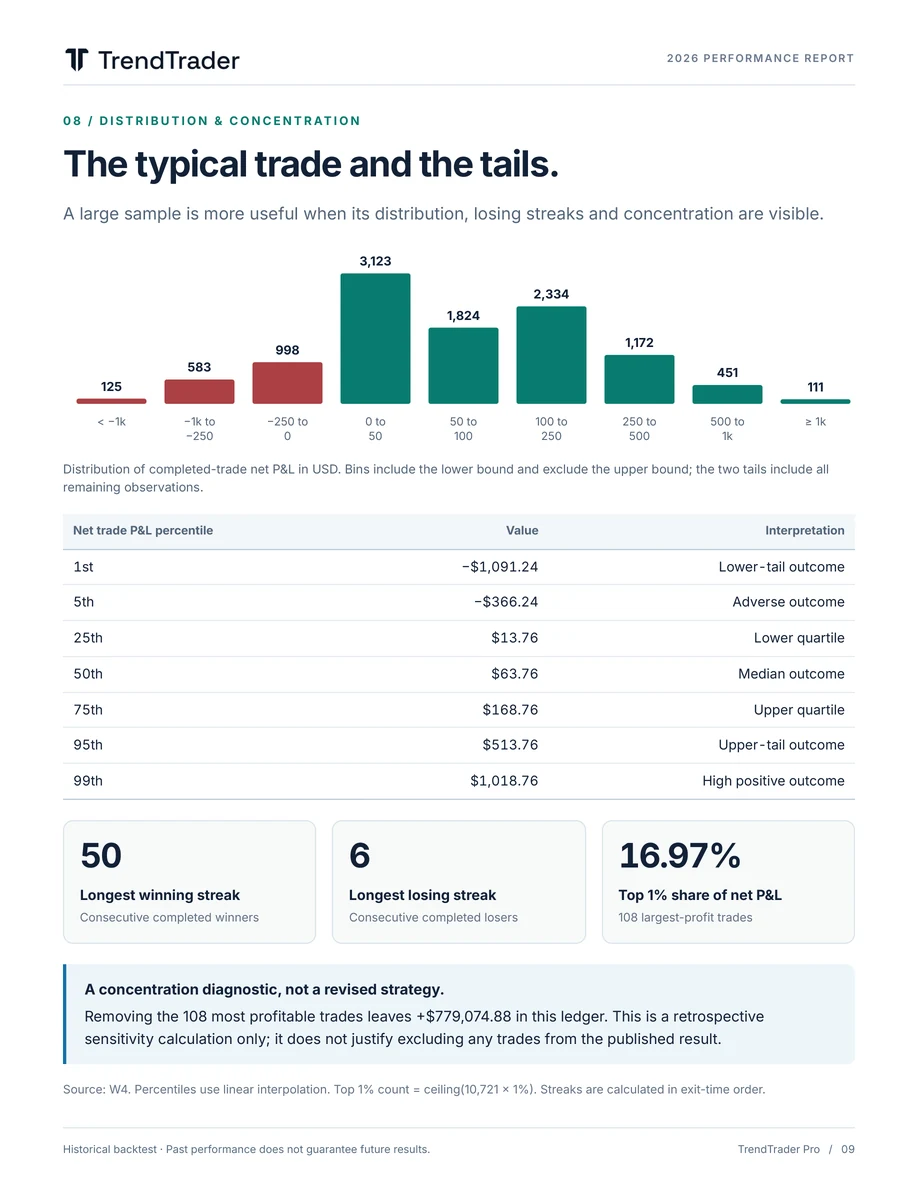
The typical trade and the tails.
A large sample is more useful when its distribution, losing streaks and concentration are visible.
| Net trade P&L (USD) | Completed trades |
|---|---|
| < −1k | 125 |
| −1k to −250 | 583 |
| −250 to 0 | 998 |
| 0 to 50 | 3,123 |
| 50 to 100 | 1,824 |
| 100 to 250 | 2,334 |
| 250 to 500 | 1,172 |
| 500 to 1k | 451 |
| ≥ 1k | 111 |
Distribution of completed-trade net P&L in USD. Bins include the lower bound and exclude the upper bound; the two tails include all remaining observations.
| Net trade P&L percentile | Value | Interpretation |
|---|---|---|
| 1st | −$1,091.24 | Lower-tail outcome |
| 5th | −$366.24 | Adverse outcome |
| 25th | $13.76 | Lower quartile |
| 50th | $63.76 | Median outcome |
| 75th | $168.76 | Upper quartile |
| 95th | $513.76 | Upper-tail outcome |
| 99th | $1,018.76 | High positive outcome |
| Measure | Result | Basis |
|---|---|---|
| Longest winning streak | 50 | Consecutive completed winners |
| Longest losing streak | 6 | Consecutive completed losers |
| Top 1% share of net P&L | 16.97% | 108 largest-profit trades |
A concentration diagnostic, not a revised strategy.
Removing the 108 most profitable trades leaves +$779,074.88 in this ledger. This is a retrospective
sensitivity calculation only; it does not justify excluding any trades from the published result.
Source: W4. Percentiles use linear interpolation. Top 1% count = ceiling(10,721 × 1%). Streaks are calculated in exit-time order.
Historical backtest · Past performance does not guarantee future results. TrendTrader Pro / 09
This page could not load. Try again or select Text view above.
Read page 10 as text
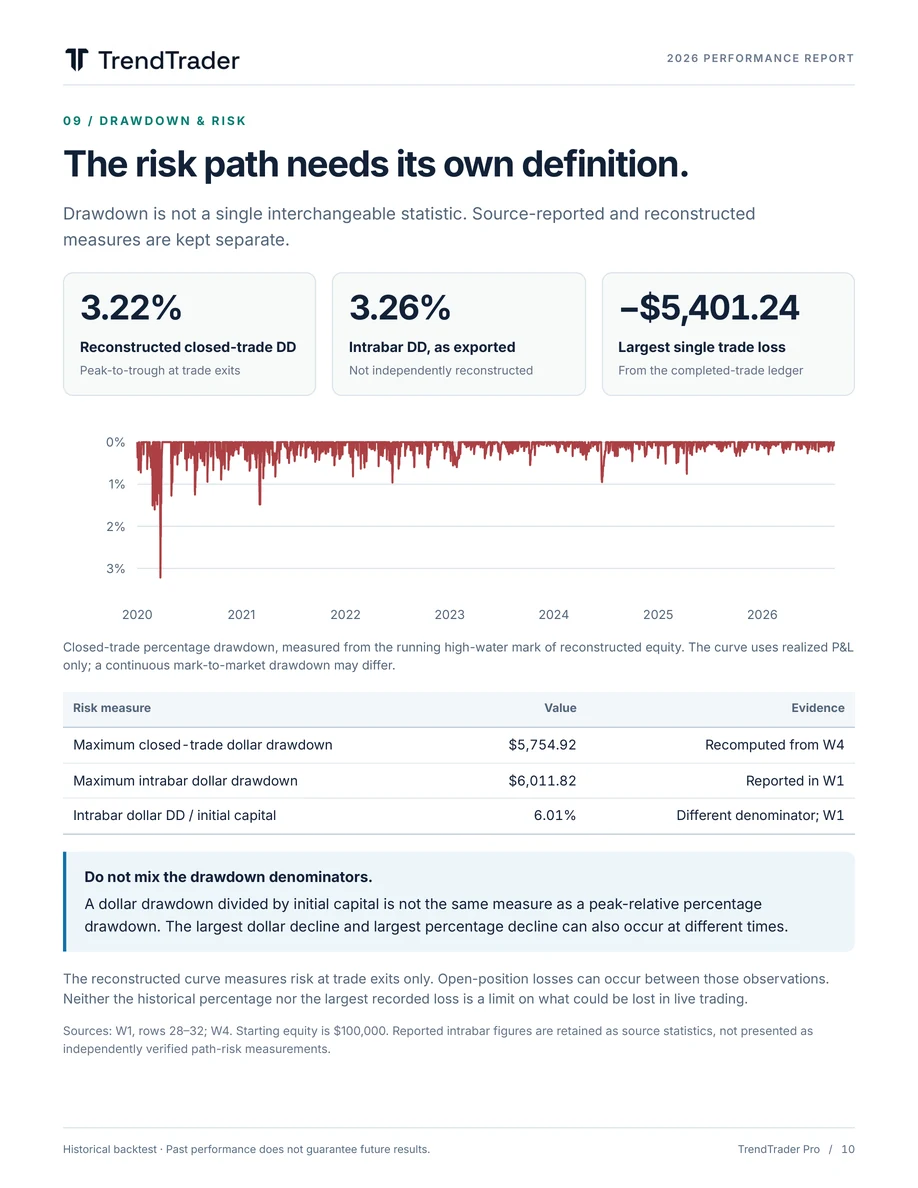
The risk path needs its own definition.
Drawdown is not a single interchangeable statistic. Source-reported and reconstructed
measures are kept separate.
| Measure | Result | Basis |
|---|---|---|
| Reconstructed closed-trade DD | 3.22% | Peak-to-trough at trade exits |
| Intrabar DD, as exported | 3.26% | Not independently reconstructed |
| Largest single trade loss | −$5,401.24 | From the completed-trade ledger |
Closed-trade percentage drawdown, measured from the running high-water mark of reconstructed equity. The curve uses realized P&L only; a continuous mark-to-market drawdown may differ.
| Risk measure | Value | Evidence |
|---|---|---|
| Maximum closed-trade dollar drawdown | $5,754.92 | Recomputed from W4 |
| Maximum intrabar dollar drawdown | $6,011.82 | Reported in W1 |
| Intrabar dollar DD / initial capital | 6.01% | Different denominator; W1 |
Do not mix the drawdown denominators.
A dollar drawdown divided by initial capital is not the same measure as a peak-relative percentage
drawdown. The largest dollar decline and largest percentage decline can also occur at different times.
The reconstructed curve measures risk at trade exits only. Open-position losses can occur between those observations. Neither the historical percentage nor the largest recorded loss is a limit on what could be lost in live trading.
Sources: W1, rows 28–32; W4. Starting equity is $100,000. Reported intrabar figures are retained as source statistics, not presented as
independently verified path-risk measurements.
Historical backtest · Past performance does not guarantee future results. TrendTrader Pro / 10
This page could not load. Try again or select Text view above.
Read page 11 as text
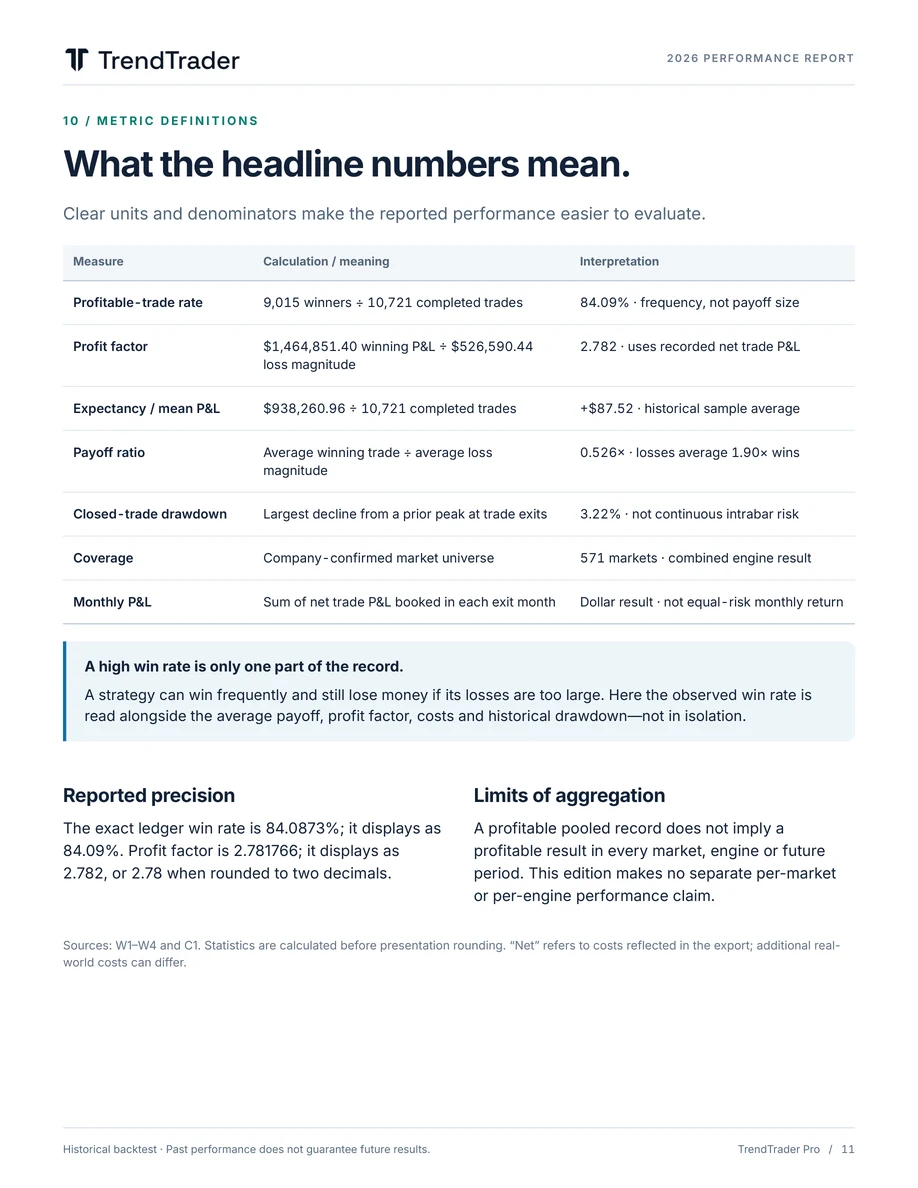
What the headline numbers mean.
Clear units and denominators make the reported performance easier to evaluate.
| Measure | Calculation / meaning | Interpretation |
|---|---|---|
| Profitable-trade rate | 9,015 winners ÷ 10,721 completed trades | 84.09% · frequency, not payoff size |
| Profit factor | $1,464,851.40 winning P&L ÷ $526,590.44 loss magnitude | 2.782 · uses recorded net trade P&L |
| Expectancy / mean P&L | $938,260.96 ÷ 10,721 completed trades | +$87.52 · historical sample average |
| Payoff ratio | Average winning trade ÷ average loss magnitude | 0.526× · losses average 1.90× wins |
| Closed-trade drawdown | Largest decline from a prior peak at trade exits | 3.22% · not continuous intrabar risk |
| Coverage | Company-confirmed market universe | 571 markets · combined engine result |
| Monthly P&L | Sum of net trade P&L booked in each exit month | Dollar result · not equal-risk monthly return |
A high win rate is only one part of the record.
A strategy can win frequently and still lose money if its losses are too large. Here the observed win rate is read alongside the average payoff, profit factor, costs and historical drawdown—not in isolation.
Reported precision
The exact ledger win rate is 84.0873%; it displays as 84.09%. Profit factor is 2.781766; it displays as 2.782, or 2.78 when rounded to two decimals.
Limits of aggregation
A profitable pooled record does not imply a profitable result in every market, engine or future period. This edition makes no separate per-market or per-engine performance claim.
Sources: W1–W4 and C1. Statistics are calculated before presentation rounding. “Net” refers to costs reflected in the export; additional real- world costs can differ.
Historical backtest · Past performance does not guarantee future results. TrendTrader Pro / 11
This page could not load. Try again or select Text view above.
Read page 12 as text
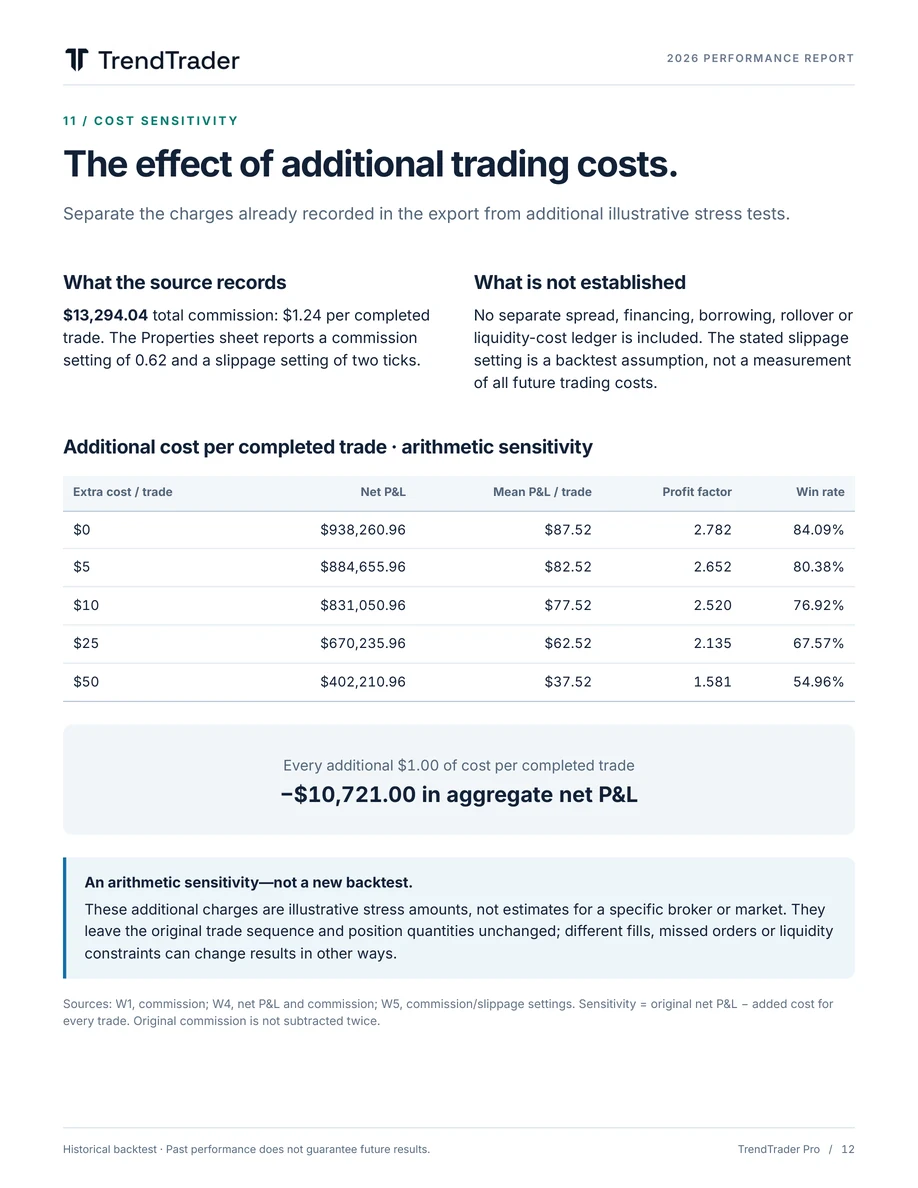
The effect of additional trading costs.
Separate the charges already recorded in the export from additional illustrative stress tests.
What the source records
$13,294.04 total commission: $1.24 per completed trade. The Properties sheet reports a commission setting of 0.62 and a slippage setting of two ticks.
What is not established
No separate spread, financing, borrowing, rollover or liquidity-cost ledger is included. The stated slippage setting is a backtest assumption, not a measurement of all future trading costs.
Additional cost per completed trade · arithmetic sensitivity
| Extra cost / trade | Net P&L | Mean P&L / trade | Profit factor | Win rate |
|---|---|---|---|---|
| $0 | $938,260.96 | $87.52 | 2.782 | 84.09% |
| $5 | $884,655.96 | $82.52 | 2.652 | 80.38% |
| $10 | $831,050.96 | $77.52 | 2.520 | 76.92% |
| $25 | $670,235.96 | $62.52 | 2.135 | 67.57% |
| $50 | $402,210.96 | $37.52 | 1.581 | 54.96% |
Every additional $1.00 of cost per completed trade −$10,721.00 in aggregate net P&L
An arithmetic sensitivity—not a new backtest.
These additional charges are illustrative stress amounts, not estimates for a specific broker or market. They leave the original trade sequence and position quantities unchanged; different fills, missed orders or liquidity
constraints can change results in other ways.
Sources: W1, commission; W4, net P&L and commission; W5, commission/slippage settings. Sensitivity = original net P&L − added cost for every trade. Original commission is not subtracted twice.
Historical backtest · Past performance does not guarantee future results. TrendTrader Pro / 12
This page could not load. Try again or select Text view above.
Read page 13 as text
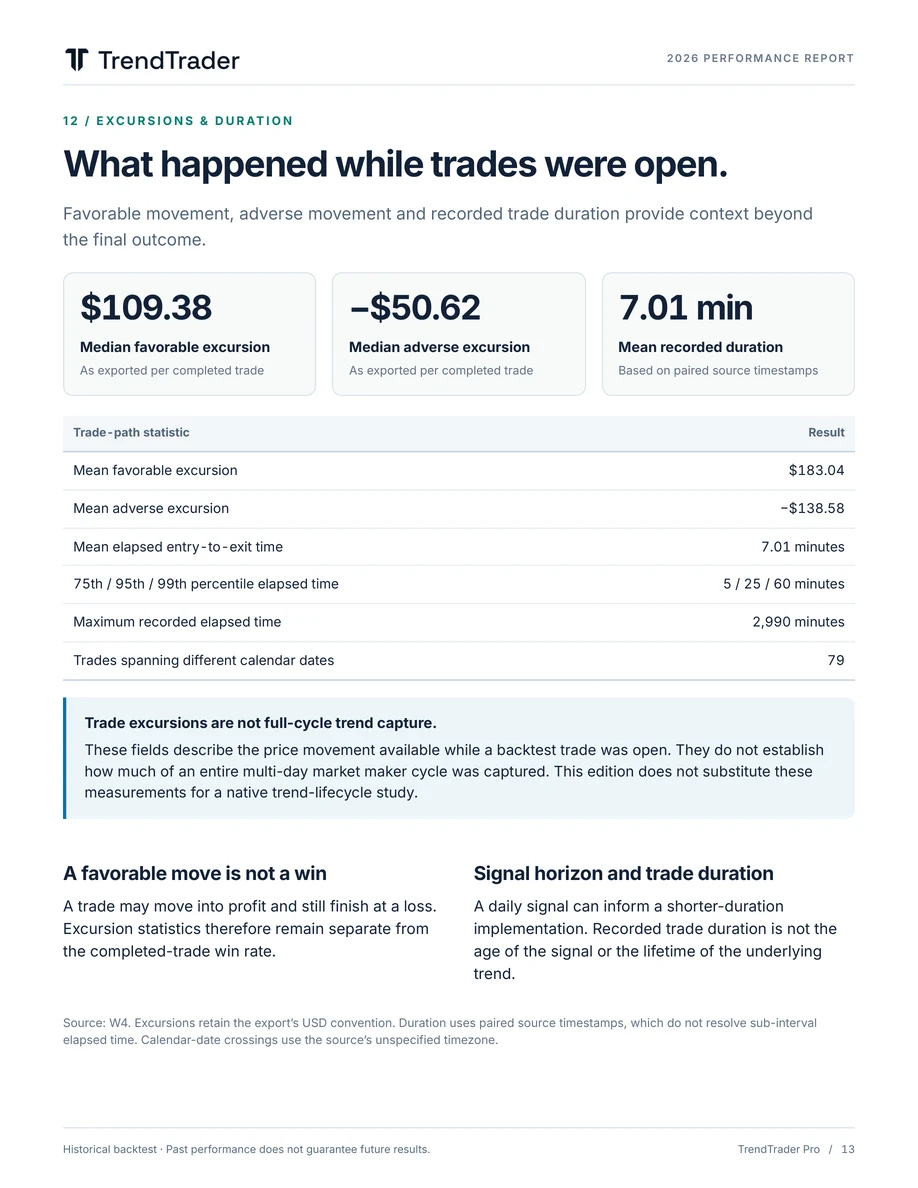
What happened while trades were open.
Favorable movement, adverse movement and recorded trade duration provide context beyond
the final outcome.
| Measure | Result | Basis |
|---|---|---|
| Median favorable excursion | $109.38 | As exported per completed trade |
| Median adverse excursion | −$50.62 | As exported per completed trade |
| Mean recorded duration | 7.01 min | Based on paired source timestamps |
| Trade-path statistic | Result |
|---|---|
| Mean favorable excursion | $183.04 |
| Mean adverse excursion | −$138.58 |
| Mean elapsed entry-to-exit time | 7.01 minutes |
| 75th / 95th / 99th percentile elapsed time | 5 / 25 / 60 minutes |
| Maximum recorded elapsed time | 2,990 minutes |
| Trades spanning different calendar dates | 79 |
Trade excursions are not full-cycle trend capture.
These fields describe the price movement available while a backtest trade was open. They do not establish how much of an entire multi-day market maker cycle was captured. This edition does not substitute these measurements for a native trend-lifecycle study.
A favorable move is not a win
A trade may move into profit and still finish at a loss. Excursion statistics therefore remain separate from the completed-trade win rate.
Signal horizon and trade duration
A daily signal can inform a shorter-duration implementation. Recorded trade duration is not the age of the signal or the lifetime of the underlying trend.
Source: W4. Excursions retain the export’s USD convention. Duration uses paired source timestamps, which do not resolve sub-interval elapsed time. Calendar-date crossings use the source’s unspecified timezone.
Historical backtest · Past performance does not guarantee future results. TrendTrader Pro / 13
This page could not load. Try again or select Text view above.
Read page 14 as text
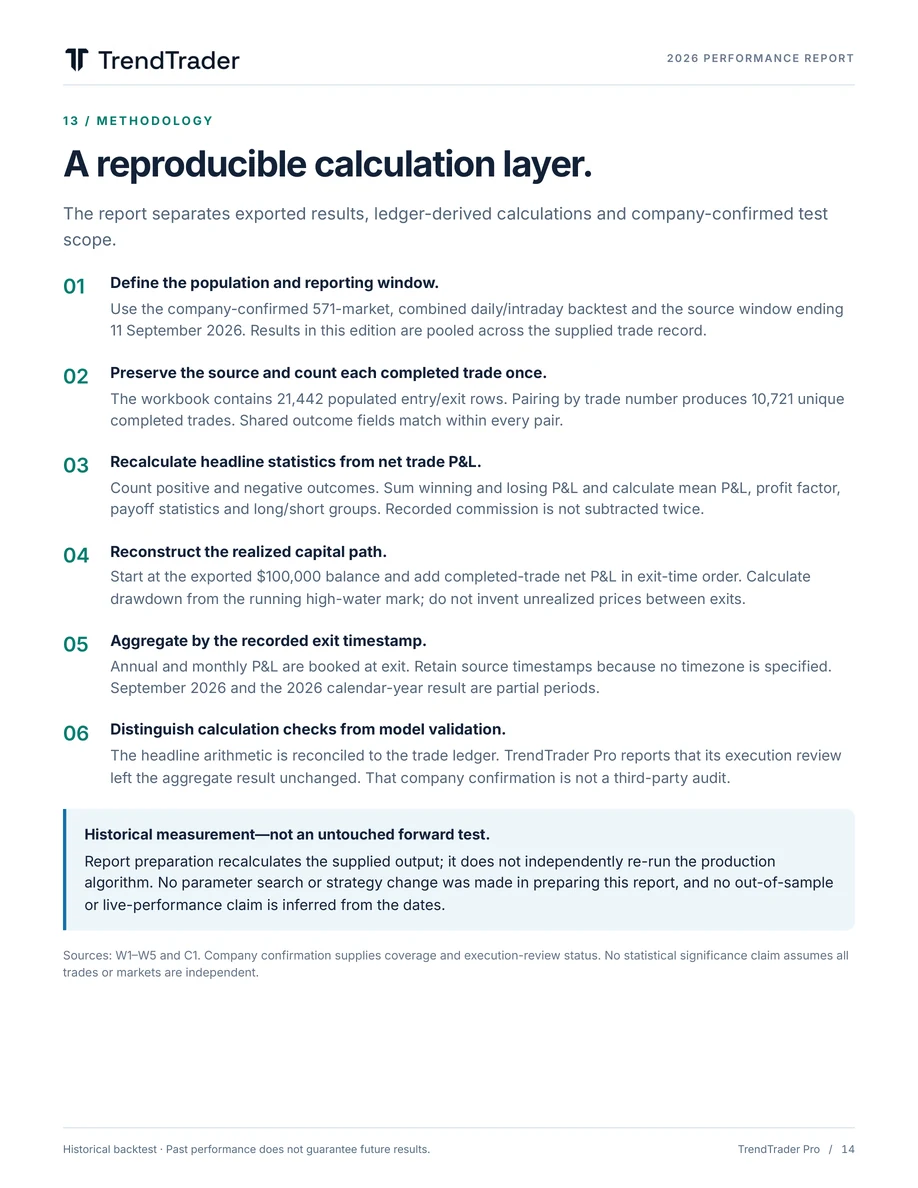
A reproducible calculation layer.
The report separates exported results, ledger-derived calculations and company-confirmed test
scope.
01 Define the population and reporting window.
Use the company-confirmed 571-market, combined daily/intraday backtest and the source window ending 11 September 2026. Results in this edition are pooled across the supplied trade record.
02 Preserve the source and count each completed trade once.
The workbook contains 21,442 populated entry/exit rows. Pairing by trade number produces 10,721 unique completed trades. Shared outcome fields match within every pair.
03 Recalculate headline statistics from net trade P&L.
Count positive and negative outcomes. Sum winning and losing P&L and calculate mean P&L, profit factor, payoff statistics and long/short groups. Recorded commission is not subtracted twice.
04 Reconstruct the realized capital path.
Start at the exported $100,000 balance and add completed-trade net P&L in exit-time order. Calculate
drawdown from the running high-water mark; do not invent unrealized prices between exits.
05 Aggregate by the recorded exit timestamp.
Annual and monthly P&L are booked at exit. Retain source timestamps because no timezone is specified. September 2026 and the 2026 calendar-year result are partial periods.
06 Distinguish calculation checks from model validation.
The headline arithmetic is reconciled to the trade ledger. TrendTrader Pro reports that its execution review
left the aggregate result unchanged. That company confirmation is not a third-party audit.
Historical measurement—not an untouched forward test.
Report preparation recalculates the supplied output; it does not independently re-run the production algorithm. No parameter search or strategy change was made in preparing this report, and no out-of-sample
or live-performance claim is inferred from the dates.
Sources: W1–W5 and C1. Company confirmation supplies coverage and execution-review status. No statistical significance claim assumes all trades or markets are independent.
Historical backtest · Past performance does not guarantee future results. TrendTrader Pro / 14
This page could not load. Try again or select Text view above.
Read page 15 as text
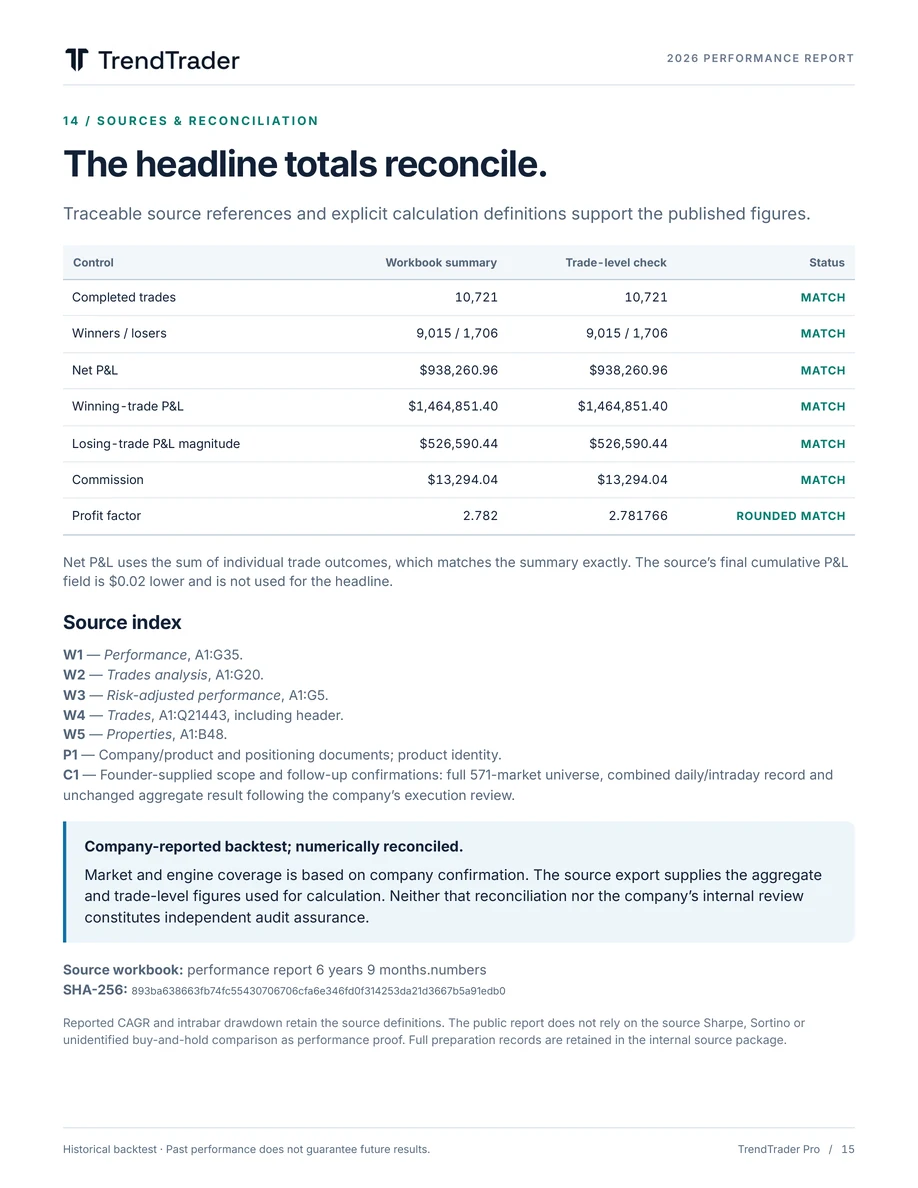
The headline totals reconcile.
Traceable source references and explicit calculation definitions support the published figures.
| Control | Workbook summary | Trade-level check | Status |
|---|---|---|---|
| Completed trades | 10,721 | 10,721 | MATCH |
| Winners / losers | 9,015 / 1,706 | 9,015 / 1,706 | MATCH |
| Net P&L | $938,260.96 | $938,260.96 | MATCH |
| Winning-trade P&L | $1,464,851.40 | $1,464,851.40 | MATCH |
| Losing-trade P&L magnitude | $526,590.44 | $526,590.44 | MATCH |
| Commission | $13,294.04 | $13,294.04 | MATCH |
| Profit factor | 2.782 | 2.781766 | ROUNDED MATCH |
Net P&L uses the sum of individual trade outcomes, which matches the summary exactly. The source’s final cumulative P&L field is $0.02 lower and is not used for the headline.
Source index
W1 — Performance, A1:G35. W2 — Trades analysis, A1:G20. W3 — Risk-adjusted performance, A1:G5. W4 — Trades, A1:Q21443, including header. W5 — Properties, A1:B48. P1 — Company/product and positioning documents; product identity. C1 — Founder-supplied scope and follow-up confirmations: full 571-market universe, combined daily/intraday record and unchanged aggregate result following the company’s execution review.
Company-reported backtest; numerically reconciled.
Market and engine coverage is based on company confirmation. The source export supplies the aggregate and trade-level figures used for calculation. Neither that reconciliation nor the company’s internal review constitutes independent audit assurance.
Source workbook: performance report 6 years 9 months.numbers SHA-256: 893ba638663fb74fc55430706706cfa6e346fd0f314253da21d3667b5a91edb0
Reported CAGR and intrabar drawdown retain the source definitions. The public report does not rely on the source Sharpe, Sortino or unidentified buy-and-hold comparison as performance proof. Full preparation records are retained in the internal source package.
Historical backtest · Past performance does not guarantee future results. TrendTrader Pro / 15
This page could not load. Try again or select Text view above.
Read page 16 as text
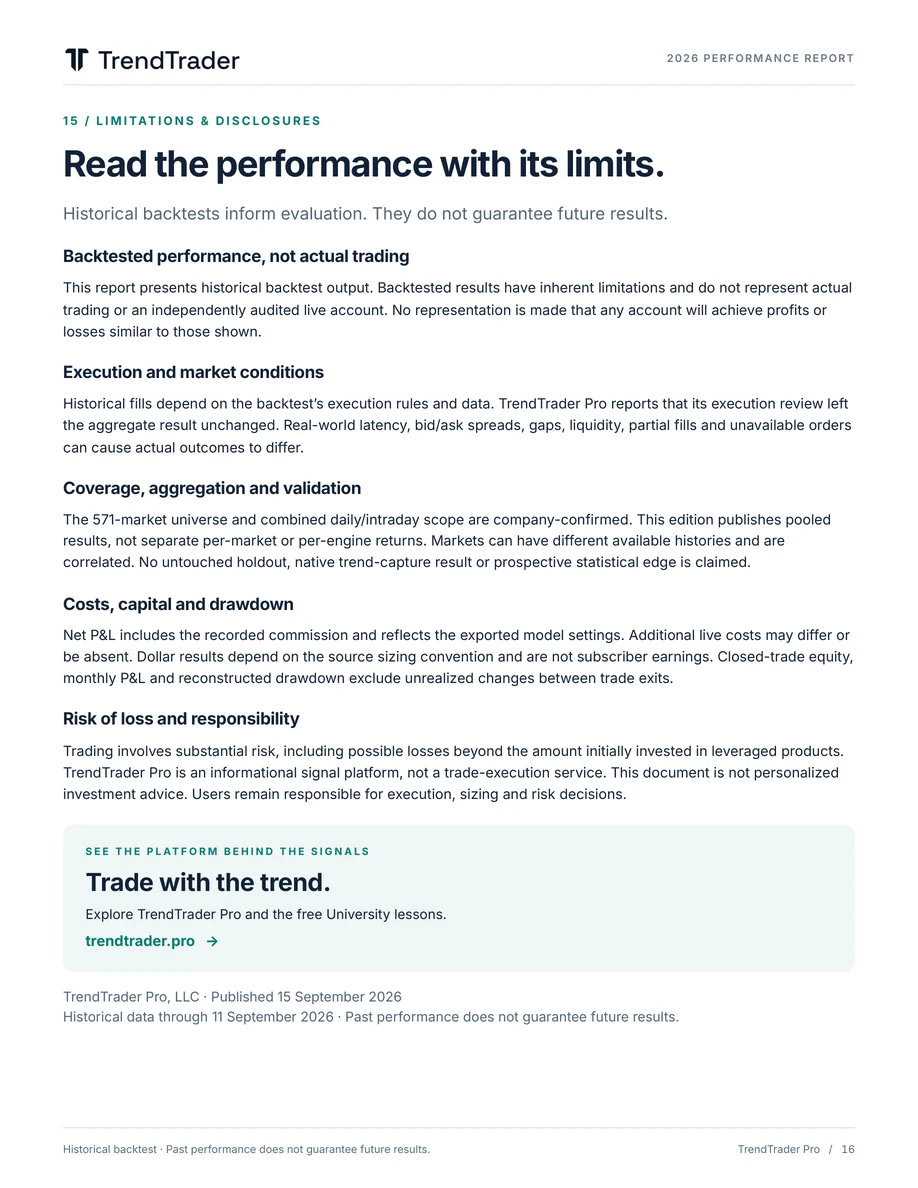
Read the performance with its limits.
Historical backtests inform evaluation. They do not guarantee future results.
Backtested performance, not actual trading
This report presents historical backtest output. Backtested results have inherent limitations and do not represent actual
trading or an independently audited live account. No representation is made that any account will achieve profits or
losses similar to those shown.
Execution and market conditions
Historical fills depend on the backtest’s execution rules and data. TrendTrader Pro reports that its execution review left
the aggregate result unchanged. Real-world latency, bid/ask spreads, gaps, liquidity, partial fills and unavailable orders
can cause actual outcomes to differ.
Coverage, aggregation and validation
The 571-market universe and combined daily/intraday scope are company-confirmed. This edition publishes pooled
results, not separate per-market or per-engine returns. Markets can have different available histories and are
correlated. No untouched holdout, native trend-capture result or prospective statistical edge is claimed.
Costs, capital and drawdown
Net P&L includes the recorded commission and reflects the exported model settings. Additional live costs may differ or
be absent. Dollar results depend on the source sizing convention and are not subscriber earnings. Closed-trade equity,
monthly P&L and reconstructed drawdown exclude unrealized changes between trade exits.
Risk of loss and responsibility
Trading involves substantial risk, including possible losses beyond the amount initially invested in leveraged products.
TrendTrader Pro is an informational signal platform, not a trade-execution service. This document is not personalized
investment advice. Users remain responsible for execution, sizing and risk decisions.
S E E T H E P L AT F O R M B E H I N D T H E S I G N A L S Trade with the trend.
Explore TrendTrader Pro and the free University lessons.
trendtrader.pro →
TrendTrader Pro, LLC · Published 15 September 2026 Historical data through 11 September 2026 · Past performance does not guarantee future results.
Historical backtest · Past performance does not guarantee future results. TrendTrader Pro / 16