

Trend Trading Strategies: A Complete Beginner's Guide
Trend trading means entering in the direction of a market's established move and holding until it reverses. Learn to identify the three trend types and use the most effective trend trading indicators.

Trend trading is a strategy built around a single principle: a market that is moving in one direction is more likely to continue in that direction than to reverse immediately. A trend trader identifies an established directional move, enters in its favor, and holds the position until that move shows signs of ending. It applies to any market, any asset class, and any timeframe.
What Is Trend Trading?
Trend trading means positioning yourself in the direction of a market's prevailing momentum and holding that position for as long as the momentum continues.
Unlike counter-trend strategies, which try to pick tops and bottoms, trend trading does not require you to be right about when a move ends. You enter after the direction is already established and exit when the structure changes. The goal is to capture the middle portion of a significant directional move, not the entire thing.
Most trend traders use the daily or four-hour chart as their primary timeframe. The strategy suits swing traders (days to weeks) and position traders (weeks to months) best. Both are riding the same directional move at different scales. Day traders can apply trend principles too, but the edge is clearest when you give trades room to run.
How to Identify a Market Trend
The three primary trend types are uptrend, downtrend, and sideways (also called ranging). Identifying which of these three states a market is in before you enter is the most important skill in trend trading.
Uptrend: Higher Highs and Higher Lows
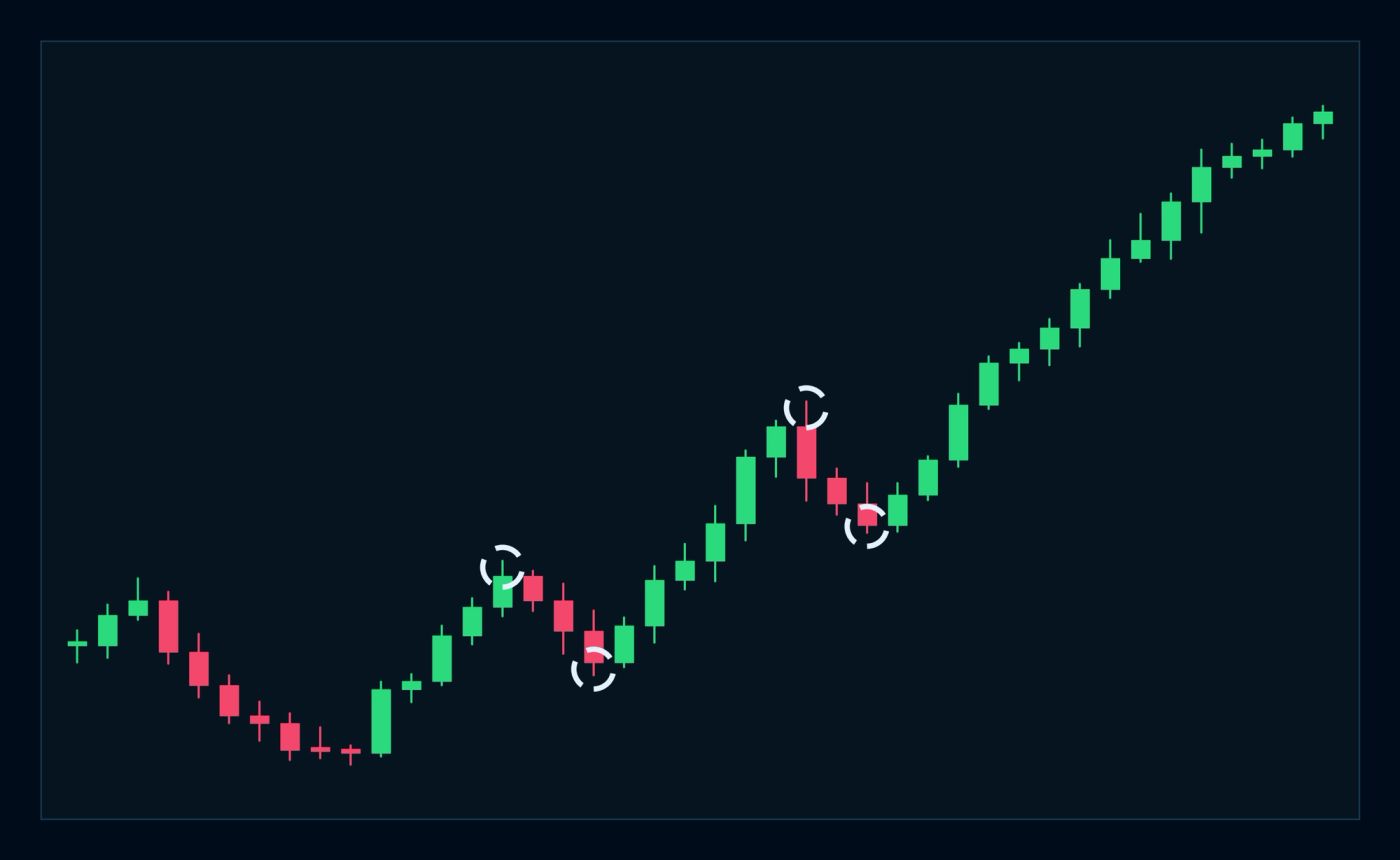
An uptrend produces a sequence of higher highs and higher lows. Each advance pushes price above the previous peak. Each pullback holds above the previous pullback low. That repeating structure of expanding upward swings with shallower corrections defines an uptrend. As long as the most recent low is above the prior low, the uptrend is intact.
Downtrend: Lower Lows and Lower Highs
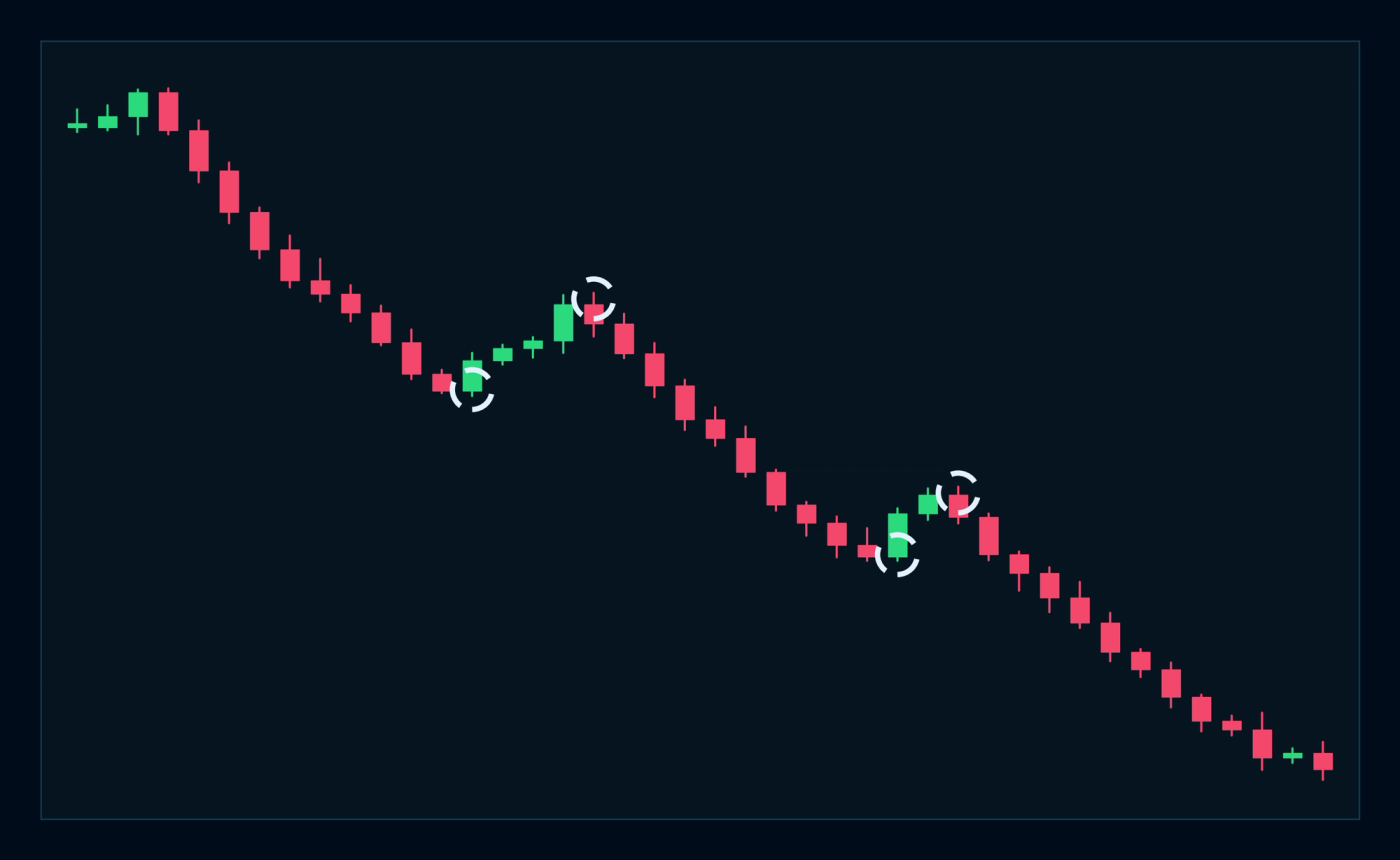
A downtrend is the mirror image. Price makes lower lows and lower highs. Each selloff drives price below the previous trough. Each bounce fails to reach the previous bounce high. The structure is intact as long as each new low is below the prior one.
Sideways (Ranging) Market
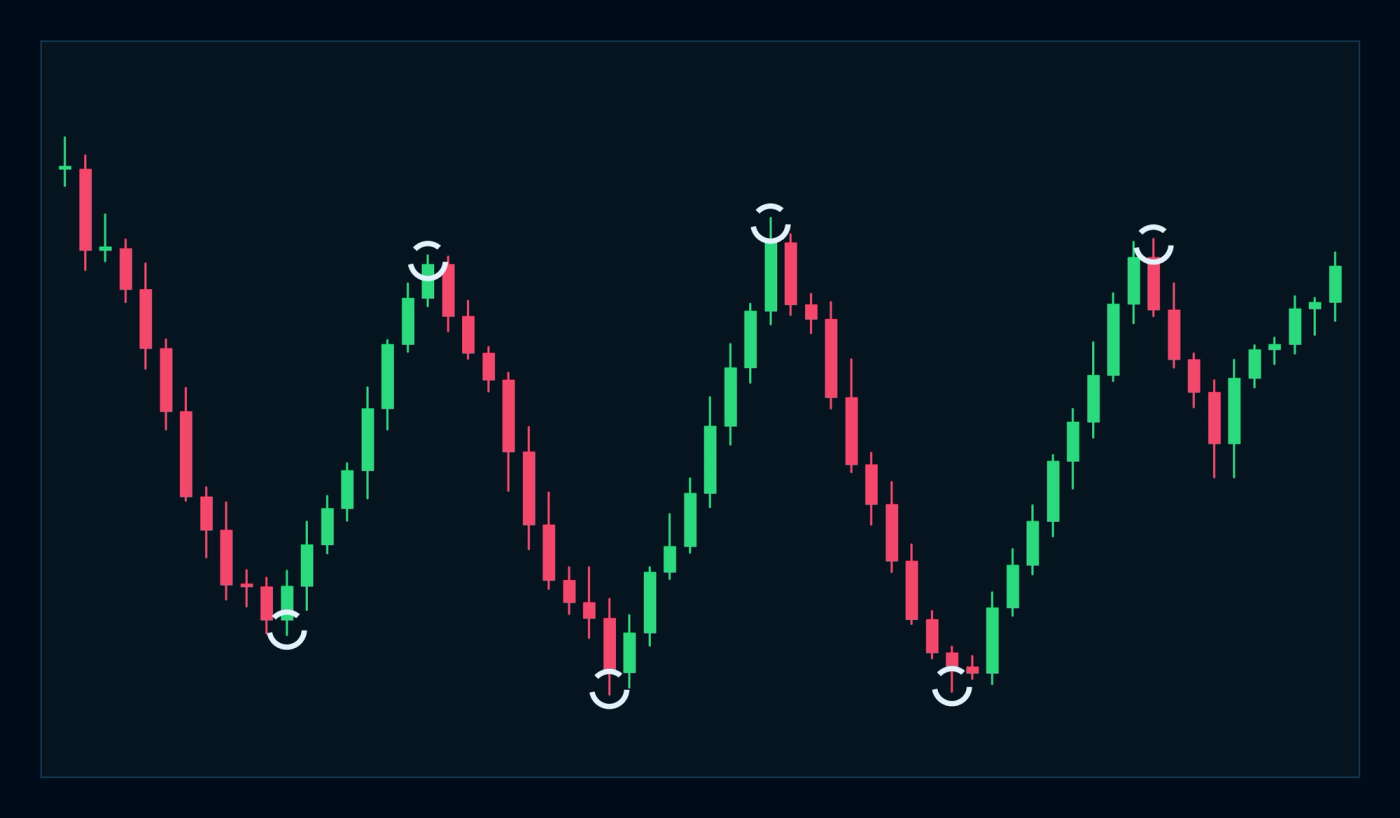
When price is making neither higher highs nor lower lows, it is ranging. The market moves horizontally between a ceiling (resistance) and a floor (support). Trend strategies produce poor results in ranging conditions because the directional signals they generate tend to reverse quickly. Knowing when a market is ranging is just as important as knowing when it is trending, because it tells you when to stay out.
The Three Best Trend Trading Indicators
The three most widely used trend trading indicators are the moving average, the relative strength index (RSI), and the average directional index (ADX). Moving averages identify direction. The RSI tracks momentum and signals when a trend is maturing. The ADX measures trend strength to filter out low-quality setups.
Used together, these three indicators cover direction, momentum, and strength. No single one is sufficient on its own.
Moving Average Strategy
A moving average (MA) plots the average closing price over a defined number of periods, creating a smoothed line that makes trend direction easier to read without the noise of individual candles. When price is above the moving average, the trend is up. When price is below it, the trend is down.
The most commonly used moving averages are the 50-period and 200-period. A price trading above a rising 50-period moving average is one of the simplest and most widely applied trend filters in markets.
How to Use the EMA Crossover
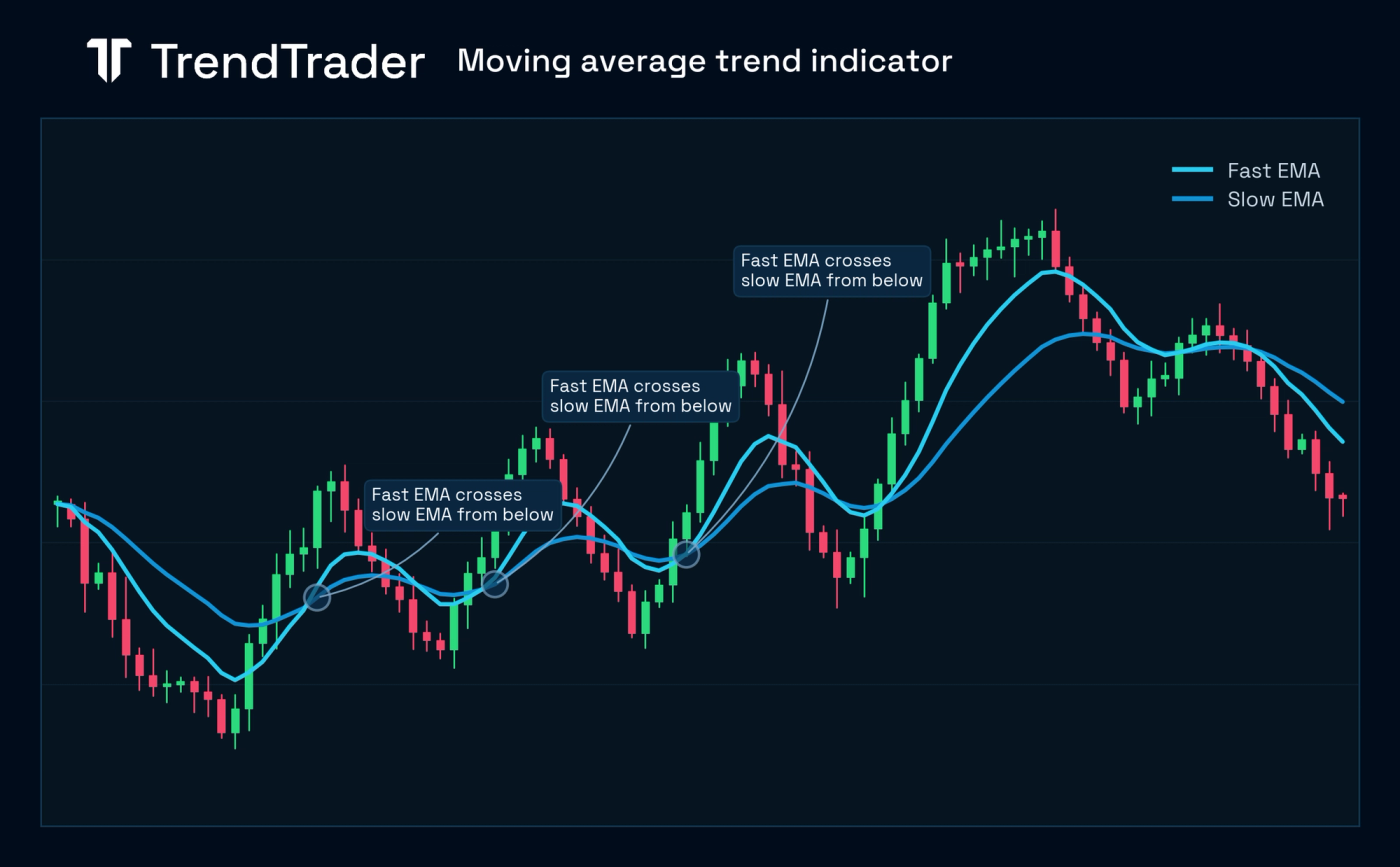
A common strategy pairs two exponential moving averages (EMAs): a fast EMA and a slow EMA. The fast EMA (for example, a 9-period) responds to price changes quickly. The slow EMA (for example, a 21-period) responds more slowly and reflects the longer-term trend.
When the fast EMA crosses above the slow EMA, it signals a potential uptrend beginning. A trend trader looks for long entries after that crossover. When the fast EMA crosses below the slow EMA, it signals a potential downtrend. Short entries follow.
Moving averages are lagging indicators. They confirm direction after a move has already started, not before. Do not use them to try to predict turning points. Use them to confirm that a trend is underway, then trade in that direction.
RSI Trend Strategy
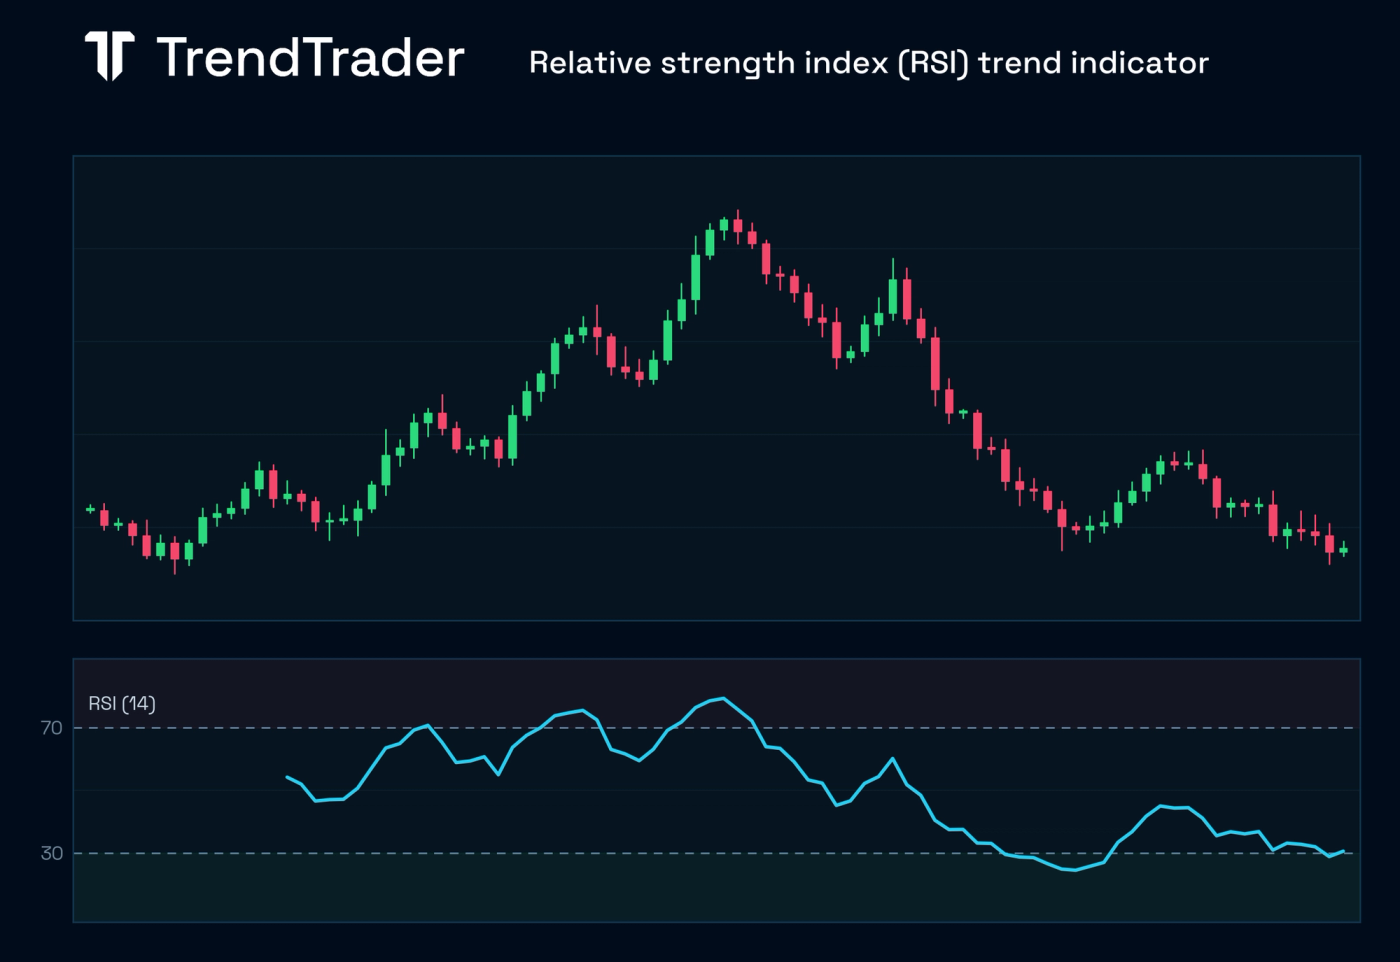
The relative strength index (RSI) measures momentum on a scale from 0 to 100. It calculates the ratio of average gains to average losses over a lookback period, typically 14 periods. When the RSI is above 70, the market is considered overbought. When it is below 30, it is considered oversold.
How to Use RSI for Trend Trading
Most traders use the RSI as a reversal signal, exiting longs when RSI exceeds 70 and exiting shorts when RSI falls below 30. Trend traders use it differently.
In a strong uptrend, the RSI can stay above 70 for weeks. Exiting every time it crosses that level means abandoning perfectly good trend trades too early. A more useful approach: watch for the RSI to pull back toward the 40 to 50 zone during a correction. That zone often acts as support on the RSI during uptrends, marking the end of the pullback and the resumption of the move higher. That pullback level is a lower-risk re-entry.
In a downtrend, the RSI can remain below 30 for an extended period. Watch for bounces toward the 50 to 60 zone as potential short-entry zones when the bounce exhausts.
ADX Trend Strategy
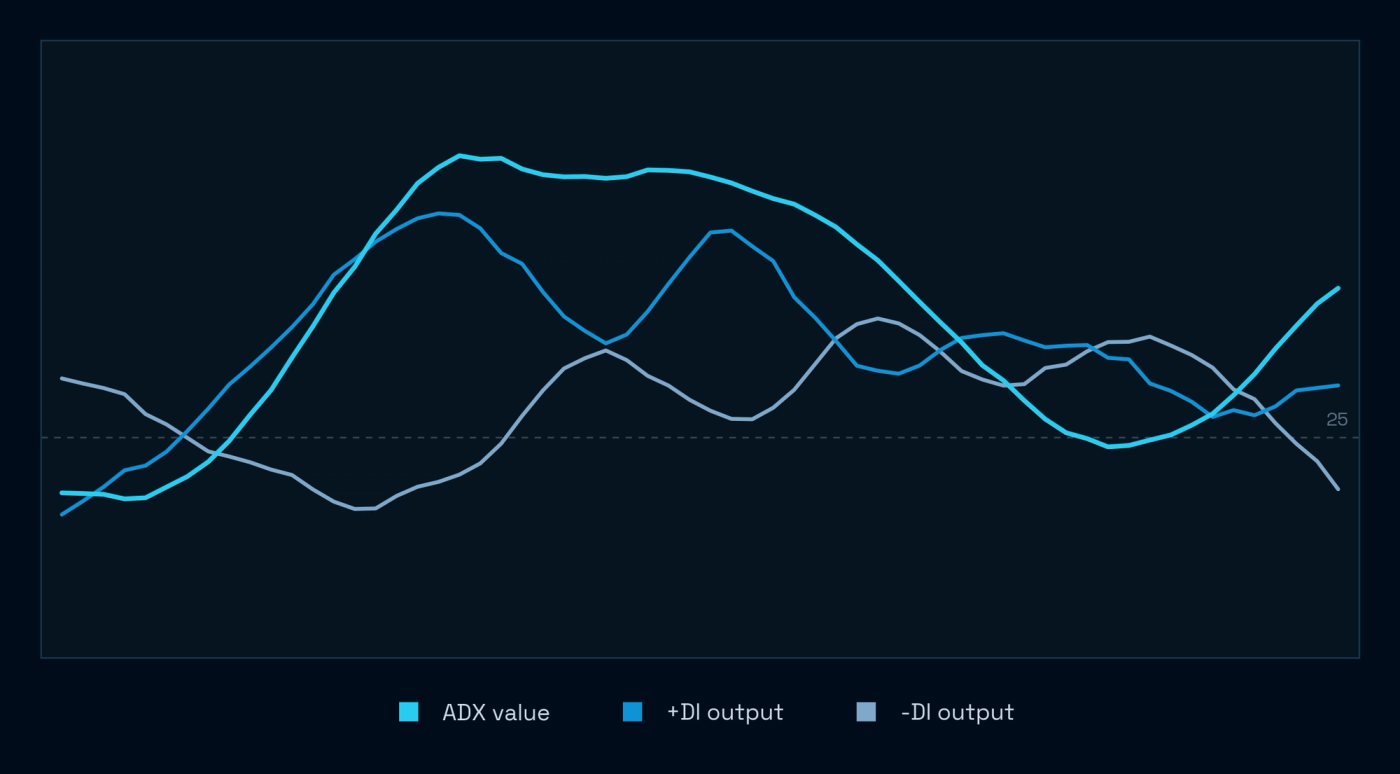
The average directional index (ADX) measures the strength of a trend regardless of whether it is up or down. It runs from 0 to 100. Readings above 25 indicate a trending market. Readings below 20 indicate a ranging or directionless market where trend strategies have limited edge. Readings above 50 indicate a very strong trend.
How to Read ADX and DMI
The ADX is plotted alongside two directional movement lines: the positive directional indicator (+DI) and the negative directional indicator (-DI). Together, these three lines form the directional movement index (DMI) system.
When +DI crosses above -DI and the ADX is above 25, it signals upward directional momentum and a possible long entry. When -DI crosses above +DI and the ADX is above 25, it signals downward directional momentum and a possible short entry.
Use the ADX as your first filter before anything else. If the ADX is below 20, the moving average crossover and RSI signals that appear will produce false entries in choppy conditions. The ADX tells you whether the other indicators are worth acting on.
How to Choose a Market for Trend Trading
Trend trading works across forex, crypto, indices, commodities, and equities. Different markets trend at different times, driven by different forces.
Forex pairs trend during macro cycles: interest rate divergence between central banks, inflation surprises, and political events. Gold (XAUUSD) and crude oil trend on supply shifts and geopolitical developments. Equity indices produce sustained uptrends in risk-on environments and sharp downtrends during corrections and bear markets. Crypto, particularly Bitcoin, produces some of the most powerful trends of any asset class and some of the most violent reversals.
The practical approach is to watch multiple markets and trade whichever is in the clearest, most confirmed trend rather than forcing entries on a market you prefer that is currently ranging. This is where a directional signal tool can help. TrendTrader tracks whether each instrument is in a Buy or Sell state across forex, crypto, indices, and commodities, and shows how many days the current direction has held. A long-running direction with fresh momentum across multiple markets is a signal cluster worth paying attention to. See the pricing page for details.
Risk Management for Trend Traders
The two core risk tools for trend traders are a stop-loss to define maximum downside and a trailing stop to protect profit as the trade extends.
Stop-loss placement follows market structure. In an uptrend, place the stop below the most recent higher low. If price breaks that level, the trend structure is broken and the original reason for the trade no longer holds. In a downtrend, place the stop above the most recent lower high.
As a trend extends, move the stop behind each new structural level. In an uptrend, raise the stop below each new higher low that forms. This technique, known as a trailing stop, locks in accumulated profit while keeping the trade open as long as the trend continues. It is what allows trend traders to capture extended moves without giving back all gains when the reversal finally comes.
Position sizing matters as much as stop placement. Risk a consistent, small percentage of your account per trade (one to two percent is common practice). If the stop distance on a setup is wide, reduce the position size so the dollar risk stays constant. A trade with a wide stop should never threaten a significant portion of your account. For more on market structure signals like break of structure (BOS) and change of character (CHoCH), which help identify when trends end, see the related articles on the TrendTrader blog.
Common Trend Trading Mistakes
Entering too late. By the time a trend is obvious, you are already entering mid-move. That is acceptable. Waiting for absolute certainty until the trend is near exhaustion is not. The indicators above are designed to identify a trend early enough to act, not to confirm it after the entire move has run.
Exiting too early. Cutting a trend trade the moment it pulls back is one of the most common and costly errors. Pullbacks are part of the trend structure. They are not exit signals. Hold through them unless price breaks a structural level that signals the trend has ended.
Trading in ranging markets. Moving averages and RSI generate signals in flat markets too. They just do not work reliably there. Always check the ADX before entering a trend trade. Below 20, wait for a trend to develop rather than forcing entries on signals that lack directional follow-through.
Ignoring the higher timeframe. A downtrend on the hourly chart might be a pullback on the daily chart. Always establish the trend direction on at least one timeframe above your entry timeframe before committing to a direction.
Letting losers run. Trend traders sometimes hold losing positions hoping the trend will resume. If price has broken the structural level that defined your stop, exit. Preserving capital for the next setup is more valuable than hoping a broken setup recovers.
Frequently Asked Questions
What is the most effective trend trading strategy?
There is no single most effective trend trading strategy that works in all conditions. The most widely used combination is an EMA crossover for direction, the ADX above 25 for trend strength confirmation, and a pullback to a key RSI level for entry timing. Each indicator addresses a different element: direction, strength, and momentum. Using all three together filters out the majority of false signals.
What is the difference between trend trading and swing trading?
Trend trading and swing trading overlap significantly. Swing traders hold for days to weeks, typically within a single trend. Trend traders may hold for weeks to months, staying in for the full duration of a major directional move. Both strategies trade in the direction of prevailing momentum. The difference is holding period and how much drawdown the trader tolerates while waiting for the trend to resume. Most swing traders are effectively trend traders with a shorter time horizon.
Is trend trading profitable?
No strategy produces consistent profits in all market conditions, and trend trading is no exception. In clearly directional markets, a disciplined trend approach can capture significant portions of major moves. In extended sideways periods, it produces repeated small losses as signals fail. The structural logic behind trend trading, that established moves tend to persist, is real. But it does not eliminate risk or guarantee outcomes. Risk management determines long-run results more than any entry method. Trading carries risk of loss.
Which timeframe is best for trend trading?
The daily chart is the most commonly used timeframe for trend trading because it filters out intraday noise and produces cleaner structure. Swing traders typically use the four-hour and daily charts. Position traders use the weekly. Entry timing can be refined on a lower timeframe, but overall trend direction should always be established on a higher timeframe first. Never trade a trend on a lower timeframe that is just a pullback on the chart above.
Which markets trend the most?
Commodities (Gold, crude oil) and cryptocurrency (Bitcoin, Ethereum) tend to produce the most extended and powerful directional trends. Forex major pairs trend strongly during macro policy cycles. Equity indices produce sustained moves during bull and bear market cycles but can range for extended periods between major shifts. The market that is trending most strongly right now, as measured by structure and ADX, is almost always a better trade than a market you prefer that is currently flat.
This article is for educational purposes only and does not constitute financial advice. Trading involves significant risk of loss. Do your own research and consult a licensed financial advisor before making any trading decisions.
